Advertisements
Advertisements
प्रश्न
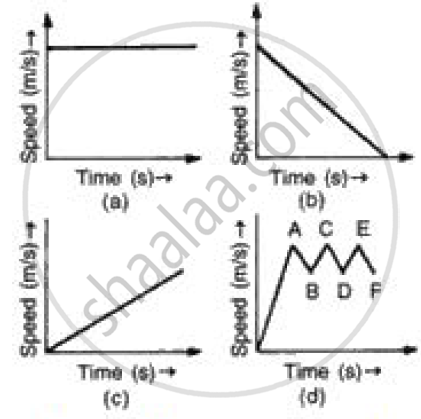
(i) In speed time graph uniform motion is given by a straight line parallel to x axis so figure (a) denotes the uniform motion.
(ii) In speed time graph motion with increasing speed is shown by straight line with positive slope so figure (c) denotes the motion with speed increasing.
(iii) In speed time graph motion with decreasing speed is shown by straight line with negative slope so figure (b) denotes the motion with speed decreasing.
(iv) In speed time graph motion with oscillating speed is shown by zigzag line so figure {d) denotes the motion with speed oscillating.
उत्तर
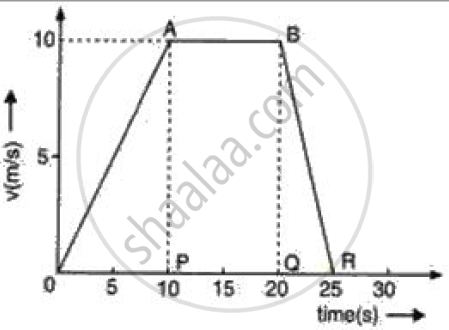
As we know that acceleration is given by the slope of the velocity-time graph so we have to calculate the slope of the graph of each stage of motion,
Acceleration during O to P = (10 - 0)/ (10 - 0) = 1 ms-2
Acceleration during P to Q = (10 - 10)/ (20 - 10) = 0 ms-2
Acceleration during Q to R = (0 - 10) / (25 -20) = - 2 ms-2.
APPEARS IN
संबंधित प्रश्न
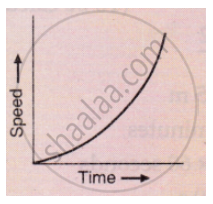
What conclusion can you draw about the acceleration of a body from the speed-time graph shown below .
Study the speed-time graph of a car given alongside and answer the following questions:

(i) What type of motion is represented by OA ?
(ii) What type of motion is represented by AB ?
(iii) What type of motion is represented by BC ?
(iv) What is the acceleration of car from O to A ?
(v)What is the acceleration of car from A to B ?
(vi) What is the retardation of car from B to C ?
Name the physical quantity which is equal to the area under speed-time graph.
How does the slope of a speed-time graph give the acceleration of a body moving along a straight line?
Interpret the following graph:
Derive the equation
S = ut+ `1/2` at2
Using a speed- time graph
Draw the distance-time graphs of the bodies P and Q starting from rest, moving with uniform speeds with P moving faster than Q.
The slope of the speed–time graph gives ______.
Mention the uses of the velocity-time graph.
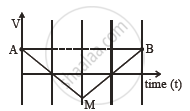
If the velocity-time graph has the shape AMB, what would be the shape of the corresponding acceleration-time graph?