Advertisements
Advertisements
प्रश्न
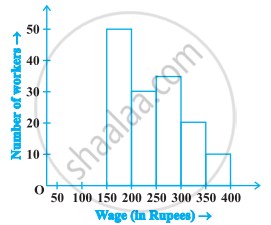
In the following figure, there is a histogram depicting daily wages of workers in a factory. Construct the frequency distribution table.

उत्तर
It is clear from the histogram that class interval start from 150 – 200, 200 – 250, having width.
The frequency distribution table is given below:
| Wage (₹) | Number of workers |
| 150 – 200 | 50 |
| 200 – 250 | 30 |
| 250 – 300 | 35 |
| 300 – 350 | 20 |
| 350 – 400 | 10 |
| Total | 145 |
APPEARS IN
संबंधित प्रश्न
The following data gives the production of foodgrains (in thousand tonnes) for some years:
| Year | 1995 | 1996 | 1997 | 1998 | 1999 | 2000 |
| Production (in thousand tonnes |
120 | 150 | 140 | 180 | 170 | 190 |
Represent the above with the help of a bar graph.
Draw, in the same diagram, a histogram and a frequency polygon to represent the following data which shows the monthly cost of living index of a city in a period of 2 years:
| Cost of living index: |
440-460 | 460-480 | 480-500 | 500-520 | 520-540 | 540-560 | 560-580 | 580-600 |
| No. of months: | 2 | 4 | 3 | 5 | 3 | 2 | 1 | 4 |
The following is the distribution of total household expenditure (in Rs.) of manual worker in a city:
| Expenditure (in Rs): |
100-150 | 150-200 | 200-250 | 250-300 | 300-350 | 350-400 | 400-450 | 450-500 |
| No. of manual workers: | 25 | 40 | 33 | 28 | 30 | 22 | 16 | 8 |
Draw a histogram and a frequency polygon representing the above data.
In the 'less than' type of ogive the cumulative frequency is plotted against
The percentage of marks obtained, in different subjects by Ashok Sharma (in an examination) is given below. Draw a bar graph to represent it.
| English | Hindi | Maths | Science | Social Studies |
| 85 | 60 | 35 | 50 | 70 |
The number of students (boys and girls) of class IX participating in different activities during their annual day function is given below:
| Activities | Dance | Speech | Singing | Quiz | Drama | Anchoring |
| Boys | 12 | 5 | 4 | 4 | 10 | 2 |
| Girls | 10 | 8 | 6 | 3 | 9 | 1 |
Draw a double bar graph for the above data.
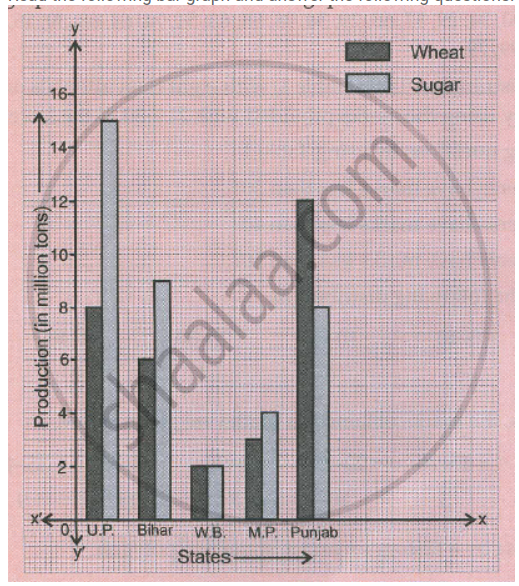
Read the following bar graph and answer the following questions:
a. What information is given by the graph?
b. Which state is the largest producer of wheat?
c. Which state is the largest producer of sugar?
d. Which state has total production of wheat and sugar as its maximum?
e. Which state has the total production of wheat and sugar minimum?
Draw a histogram to represent the following grouped frequency distribution:
| Ages (in years) | Number of teachers |
| 20 – 24 | 10 |
| 25 – 29 | 28 |
| 30 – 34 | 32 |
| 35 – 39 | 48 |
| 40 – 44 | 50 |
| 45 – 49 | 35 |
| 50 – 54 | 12 |
Following table shows a frequency distribution for the speed of cars passing through at a particular spot on a high way:
| Class interval (km/h) | Frequency |
| 30 – 40 | 3 |
| 40 – 50 | 6 |
| 50 – 60 | 25 |
| 60 – 70 | 65 |
| 70 – 80 | 50 |
| 80 – 90 | 28 |
| 90 – 100 | 14 |
Draw a histogram and frequency polygon representing the data above.
Following table gives the distribution of students of sections A and B of a class according to the marks obtained by them.
| Section A | Section B | ||
| Marks | Frequency | Marks | Frequency |
| 0 – 15 | 5 | 0 – 15 | 3 |
| 15 – 30 | 12 | 15 – 30 | 16 |
| 30 – 45 | 28 | 30 – 45 | 25 |
| 45 – 60 | 30 | 45 – 60 | 27 |
| 60 –75 | 35 | 60 – 75 | 40 |
| 75 – 90 | 13 | 75 – 90 | 10 |
Represent the marks of the students of both the sections on the same graph by two frequency polygons. What do you observe?
