Advertisements
Advertisements
प्रश्न
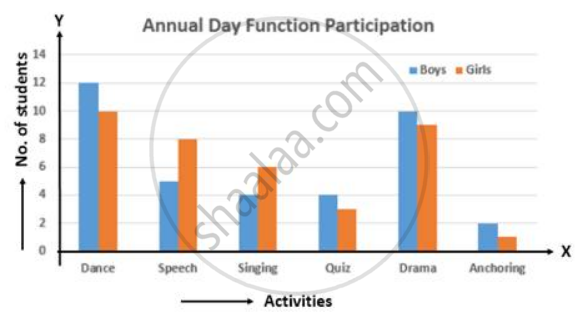
The number of students (boys and girls) of class IX participating in different activities during their annual day function is given below:
| Activities | Dance | Speech | Singing | Quiz | Drama | Anchoring |
| Boys | 12 | 5 | 4 | 4 | 10 | 2 |
| Girls | 10 | 8 | 6 | 3 | 9 | 1 |
Draw a double bar graph for the above data.
उत्तर
The double bar graph is as follows:
APPEARS IN
संबंधित प्रश्न
The following table gives the distribution of students of two sections according to the mark obtained by them:-
| Section A | Section B | ||
| Marks | Frequency | Marks | Frequency |
| 0 - 10 | 3 | 0 - 10 | 5 |
| 10 - 20 | 9 | 10 - 20 | 19 |
| 20 - 30 | 17 | 20 - 30 | 15 |
| 30 - 40 | 12 | 30 - 40 | 10 |
| 40 - 50 | 9 | 40 - 50 | 1 |
Represent the marks of the students of both the sections on the same graph by two frequency polygons. From the two polygons compare the performance of the two sections.
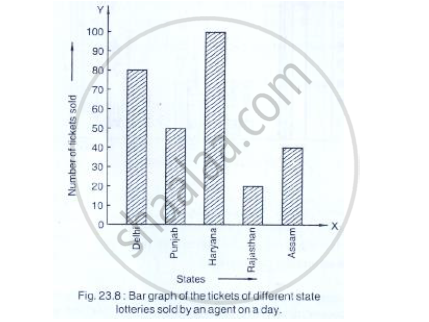
Read the bar graph shown in Fig. 23.8 and answer the following questions:

(i) What is the information given by the bar graph?
(ii) How many tickets of Assam State Lottery were sold by the agent?
(iii) Of which state, were the maximum number of tickets sold?
(iv) State whether true or false.
The maximum number of tickets sold is three times the minimum number of tickets sold.
(v) Of which state were the minimum number of tickets sold?
The following data gives the amount of manure (in thousand tonnes) manufactured by a company during some years:
| Year | 1992 | 1993 | 1994 | 1995 | 1996 | 1997 |
| Manure (in thousand tonnes) |
15 | 35 | 45 | 30 | 40 | 20 |
(i) Represent the above data with the help of a bar graph.
(ii) Indicate with the help of the bar graph the year in which the amount of manufactured by the company was maximum.
(iii) Choose the correct alternative:
The consecutive years during which there was maximum decrease in manure production are:
(a) 1994 and 1995
(b) 1992 and 1993
(c) 1996 and 1997
(d) 1995 and 1996
The income and expenditure for 5 years of a family is given in the following data:
| Years | 1995-96 | 1996-97 | 1997-98 | 1998-99 | 1999-2000 |
| Income (Rs. inthousands) |
100 | 140 | 150 | 170 | 210 |
| Expenditure (Rs. in thousands) |
80 | 130 | 145 | 160 | 190 |
Represent the above data by a gar graph.
Which one of the following is not the graphical representation of statistical data:
Construct a frequency polygon for the following data:
| Class-Intervals | 10 - 14 | 15 - 19 | 20 - 24 | 25 - 29 | 30 - 34 |
| Frequency | 5 | 8 | 12 | 9 | 4 |
For the following table, draw a bar-graph
| A | B | C | D | E | F |
| 230 | 400 | 350 | 200 | 380 | 160 |
The following tables show the mode of transport used by boys and girls for going to the same school.
| Bus | Bicycle | Walking | Other sources | |
|
Number of boys |
80 | 60 | 20 | 85 |
|
Number of girls |
90 | 75 | 35 | 60 |
Draw a double bar graph representing the above data.
For the following data, draw a pie graph.
| Subject | Hindi | English | Maths | Science | Social Study |
| Marks as percent | 60 | 45 | 42 | 48 | 75 |
The birth rate thousand of the following states over a certain period is given below:
| States | Punjab | Haryana | U.P. | Gujarat | Rajasthan | Jammu and Kashmir |
| Birth Rate (per thousand ) | 22.9 | 21.8 | 19.5 | 21.1 | 23.9 | 18.3 |
Draw a bar graph for the above data.
