Advertisements
Advertisements
प्रश्न
Choose the correct answer from given options
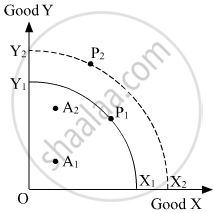
In the given figure X1Y1 and X2Y2 are Production Possibility Curves in two different periods T1 and T2 respectively for Good X and Good Y. A1 and A2 represent actual outputs and P1 and P2 represent potential outputs respectively in the two times periods.

The change in actual output of Goods X and Y over the two periods would be represented by a movement from __________.
पर्याय
A2 to P2
A1 to P2
P1 to A2
A1 to A2
उत्तर
The change in actual output of Goods X and Y over the two periods would be represented by movement from A1 to A2.
Hence, the correct answer is A1 to A2.
APPEARS IN
संबंधित प्रश्न
Distinguish between ‘increase in demand’ and increase in quantity demanded of a good.
When the income of the consumer falls the impact on a price-demand curve of an inferior good is: (choose the correct alternative)
a. Shifts to the right.
b. Shifts of the left.
c. There is upward movement along the curve.
d. There is downward movement along the curve
When is demand called perfectly inelastic?
Demand for electricity is elastic.
Fill in the blank with proper alternatives given in the bracket:
Indirect demand is also known as _______ demand.
Write short answer for the following question.
Explain the Law of Demand.
Explain the following concepts or give definitions.
Demand
Fill in the blank with appropriate alternatives given below:
Indirect demand is also known as _____________ demand.
State whether the following statement is TRUE and FALSE
Law of demand is explained by Prof. Robbins.
Give reason or explain the following statement.
Demand curve slopes downward from left to right.
Answer the following question.
Discuss the relationship between the income of the consumer and demand for a commodity with respect to normal goods, inferior goods, and necessities.
Answer the following question:
Elaborate the law of demand, with the help of a hypothetical schedule.
Area under MC curve is equal to:
Which of the following can cause an increase in demand:
Which of the following statements is true?
Read the following news report and answer the Q.97-Q.100 on the basis of the same:
The quantity of a commodity that a consumer is willing to buy and is able to afford, given the prices of goods and the consumer's tastes and preferences is called demand for the commodity. Whenever one or more of these variables change, the quantity of the good Chosen by the consumer is likely to change as well. The relation between the consumer's optimal choice of the quantity of a good and its price is very important and this relation is called the demand function. Thus, the consumer's demand function for a good gives the amount of the good that the consumer chooses at different levels of its price when the other things remain.
In which of the following cases there will be leftward shift in demand?
Which of the following statements is true?
If there is no change in the demand for commodity X, even after a rise in its price, then its demand is ______
Read the case study and answer the questions 97 to 100:
The Coca-Cola Company is an American multinational beverage company, with its headquarters in Atlanta, Georgia. The first company that conducted its operation in the soft drink industry was Coca-Cola. It is the world's largest non-alcoholic beverage company serving more than 1.8 billion consumers daily in more than 200 countries. It has a portfolio of more than 3,500 (more than 800 no or low-calorie) products. However, the company is best known for its flagship product Coca-Cola which was originally intended to be a patented medicine invented in 1886 by pharmacist John Smith Pemberton in Columbus, Georgia. The Coca-Cola products can be termed as normal goods and in August 2019 Coca-Cola introduced a new product into the market, that is, zero sugar where the demand has increased for the product in the market.
According to the council of the Australian Food Technology Association and Institute of Food Science and Technology, the Australian nonalcoholic beverages industry has been growing steadily, with a 2.3 percent increase in overall production in the year 2000 which amounts to 2.25 billion liters. However, in the re~ent years, sales of customary carbonated soft drinks have dropped as more and more customers become health conscious and move away from high-calorie sugary drinks. Soft Carbonated drinks. and other alcohol-free beverage manufacturers have also sensed the effects of intensifying competition from private-label soft drink makers. Nevertheless, sales of greater value energy and sports drinks have driven profit generation in the industry.
What has happened to the demand of zero sugar carbonated drinks?
