Advertisements
Advertisements
प्रश्न
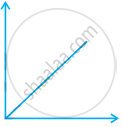
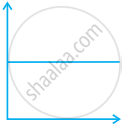
Match the following graphs of ideal gas with their co-ordinates:
| Graphical representation | x and y co-ordinates |
(i)  |
(a) pV vs. V |
(ii)  |
(b) p vs. V |
(iii)  |
(c) p vs. `1/V` |
उत्तर
| Graphical representation | x and y co-ordinates |
(i)  |
(b) p vs. V |
(ii)  |
(c) p vs. `1/V` |
(iii)  |
(a) pV vs. V |
APPEARS IN
संबंधित प्रश्न
Which of the following is the correct expression for the equation of state of van der Waals gas?
Compressibility factor for CO2 at 400 K and 71.0 bar is 0.8697. The molar volume of CO2 under these conditions is
In what way real gases differ from ideal gases.
Suppose there is a tiny sticky area on the wall of a container of gas. Molecules hitting this area stick there permanently. Is the pressure greater or less than on the ordinary area of walls?
Explain whether a gas approaches ideal behavior or deviates from ideal behaviour if it is compressed to a smaller volume at a constant temperature.
Explain whether a gas approaches ideal behavior or deviates from ideal behaviour if more gas is introduced into the same volume and at the same temperature.
Compressibility factor, Z, of a gas is given as Z = `(pV)/(nRT)`. What is the value of Z for an ideal gas?
Compressibility factor, Z, of a gas is given as Z = `(pV)/(nRT)`. For real gas what will be the effect on value of Z above Boyle’s temperature?
Assertion (A): At constant temperature, pV vs V plot for real gases is not a straight line.
Reason (R): At high pressure all gases have \[\ce{Z}\] > 1 but at intermediate pressure most gases have \[\ce{Z}\] < 1.
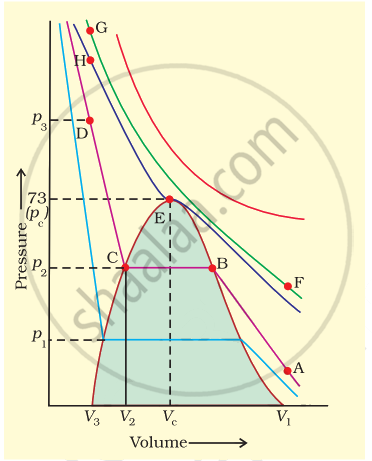
Isotherms of carbon dioxide gas are shown in figure. Mark a path for changing gas into liquid such that only one phase (i.e., either a gas or a liquid) exists at any time during the change. Explain how the temperature, volume and pressure should be changed to carry out the change.
