Advertisements
Advertisements
प्रश्न
Compressibility factor for CO2 at 400 K and 71.0 bar is 0.8697. The molar volume of CO2 under these conditions is
पर्याय
22.04 dm3
2.24 dm3
0.41 dm3
19.5 dm3
उत्तर
0.41 dm3
APPEARS IN
संबंधित प्रश्न
Calculate the volume occupied by 8.8 g of CO2 at 31.1°C and 1 bar pressure. R = 0.083 bar L K–1 mol–1.
The value of the universal gas constant depends upon
Suppose there is a tiny sticky area on the wall of a container of gas. Molecules hitting this area stick there permanently. Is the pressure greater or less than on the ordinary area of walls?
Explain whether a gas approaches ideal behavior or deviates from ideal behaviour if more gas is introduced into the same volume and at the same temperature.
A plot of volume (V) versus temperature (T) for a gas at constant pressure is a straight line passing through the origin. The plots at different values of pressure are shown in Figure. Which of the following order of pressure is correct for this gas?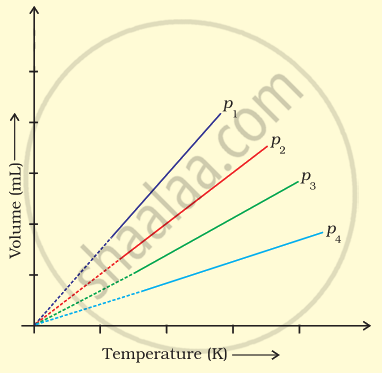
If 1 gram of each of the following gases are taken at STP, which of the gases will occupy (a) greatest volume and (b) smallest volume?
\[\ce{CO, H2O, CH4 , NO}\]
Compressibility factor, Z, of a gas is given as Z = `(pV)/(nRT)`. What is the value of Z for an ideal gas?
Compressibility factor, Z, of a gas is given as Z = `(pV)/(nRT)`. For real gas what will be the effect on value of Z above Boyle’s temperature?
Match the following graphs of ideal gas with their co-ordinates:
| Graphical representation | x and y co-ordinates |
(i)  |
(a) pV vs. V |
(ii) 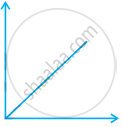 |
(b) p vs. V |
(iii) 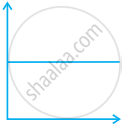 |
(c) p vs. `1/V` |
Assertion (A): At constant temperature, pV vs V plot for real gases is not a straight line.
Reason (R): At high pressure all gases have \[\ce{Z}\] > 1 but at intermediate pressure most gases have \[\ce{Z}\] < 1.
