Advertisements
Advertisements
प्रश्न
| Number of two wheelers |
Tally marks | Number of families |
| 0 | ||| | 3 |
| 1 | `cancel(|bb|bb|bb|)` `cancel(|bb|bb|bb|)` `cancel(|bb|bb|bb|)` `cancel(|bb|bb|bb|)` `cancel(|bb|bb|bb|)` ||| | 28 |
| 2 | `cancel(|bb|bb|bb|)` `cancel(|bb|bb|bb|)` |||| | 14 |
| 3 | |||| | 4 |
| 4 | | | 1 |
| Total | 50 |
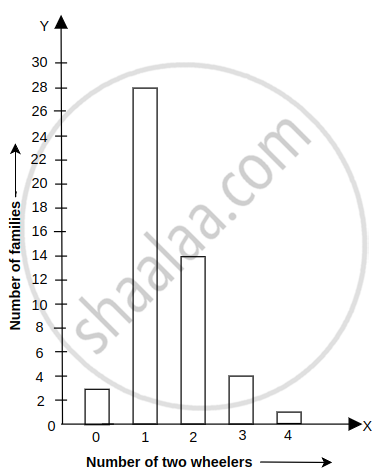
Prepare a bar graph of the data.
उत्तर
| Number of two wheelers |
Number of families |
| 0 | 3 |
| 1 | 28 |
| 2 | 14 |
| 3 | 4 |
| 4 | 1 |
Scale: 1 unit length = 2 two wheelers
APPEARS IN
संबंधित प्रश्न
Define the following term:
Raw data
Define the following term:
Discrete frequency distribution
The weights of new born babies (in kg) in a hospital on a particular day are as follows:
2.3, 2.2, 2.1, 2.7, 2.6, 3.0, 2.5, 2.9, 2.8, 3.1, 2.5, 2.8, 2.7, 2.9, 2.4
(i) Rearrange the weights in descending order.
(ii) Determine the highest weight.
(iii) Determine the lowest weight.
(iv) Determine the range.
(v) How many babies were born on that day?
(vi) How many babies weigh below 2.5 kg?
(vii) How many babies weigh more than 2.8 kg?
(viii) How many babies weigh 2.8 kg?
Following data gives the number of children in 40 families:
1, 2, 6, 5, 1, 5, 1, 3, 2, 6, 2, 3, 4, 2, 0, 0, 4, 4, 3, 2, 2, 0, 0, 1, 2, 2, 4, 3, 2, 1, 0, 5, 1, 2, 4, 3, 4, 1, 6, 2, 2.
Represent it in the form of a frequency distribution.
A die was thrown 25 times and following scores were obtained:
| 1, | 5, | 2, | 4, | 3, | 6, | 1, | 4, | 2, | 5, | 1, | 6, | 2, |
| 6, | 3, | 5, | 4, | 1, | 3, | 2, | 3, | 6, | 1, | 5, | 2, |
Prepare a frequency table of the scores.
The marks obtained by 40 students of class VIII in an examination are given below:
16, 17, 18, 3, 7, 23, 18, 13, 10, 21, 7, 1, 13, 21, 13, 15, 19, 24, 16, 3, 23, 5, 12, 18, 8, 12, 6, 8, 16, 5, 3, 5, 0, 7, 9, 12, 20, 10, 2, 23.
Divide the data into five groups, namely 0-5, 5-10, 10-15, 15-20 and 20-25 and prepare a grouped frequency table.
Construct a frequency table with class-intervals 0-5 (5 not included) of the following marks obtained by a group of 30 students in an examination.
0, 5, 7, 10, 12, 15, 20, 22, 25, 27, 8, 11, 17, 3, 6, 9, 17, 19, 21, 29, 31, 35, 37, 40, 42,45, 49, 4, 50, 16.
The daily minimum temperatures in degrees Celsius recorded in a certain Arctic region are as follows:
−12.5, −10.8, −18.6, −8.4, −10.8, −4.2, −4.8, −6.7, −13.2, −11.8, −2.3, 1.2, 2.6, 0, −2.4, 0, 3.2, 2.7, 3.4, 0, −2.4, −2.4, 0, 3.2, 2.7, 3.4, 0, −2.4, −5.8, −8.9, −14.6, −12.3, −11.5, −7.8, −2.9
Represent them as frequency distribution table taking − 19.9 to − 15 as the first class interval.
Yamini did a project ‘Animals and Birds’. She asked each child in her class about one favorite pet animal.
She used tally marks to record each answer. For example, if someone said ‘cat’ she means 5 cats. In all 24 children said ‘cat’ was their favorite animal. Help Yamini complete the table.
| Animal | Tally marks | Number |
| Cats | 24 | |
| Dogs | ||
| Rabbits | ||
| Cows | ||
| Parrots | ||
| Goats | ||
| Squirrel |
- Look at the tally marks and write the number for each animal on the table. How many children in all did Yamini talk to?
- Which is the most favorite pet animal on this table?
- Which pet will you like to have? What will you name it? Which other animals can be kept at home? Discuss.
The choices of the fruits of 42 students in a class are as follows:
A, O, B, M, A, G, B, G, A, G, B, M, A, G, M, A, B, G, M, B, A, O, M, O, G, B, O, M, G, A, A, B, M, O, M, G, B, A, M, O, M, O, where A, B, G, M and O stand for the fruits Apple, Banana, Grapes, Mango and Orange respectively. Which two fruits are liked by an equal number of students?
