Advertisements
Advertisements
प्रश्न
| Number of two wheelers |
Tally marks | Number of families |
| 0 | ||| | 3 |
| 1 | `cancel(|bb|bb|bb|)` `cancel(|bb|bb|bb|)` `cancel(|bb|bb|bb|)` `cancel(|bb|bb|bb|)` `cancel(|bb|bb|bb|)` ||| | 28 |
| 2 | `cancel(|bb|bb|bb|)` `cancel(|bb|bb|bb|)` |||| | 14 |
| 3 | |||| | 4 |
| 4 | | | 1 |
| Total | 50 |
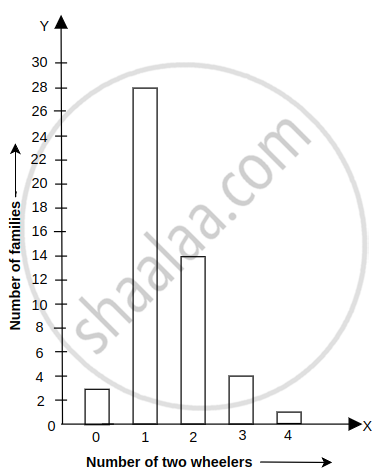
Prepare a bar graph of the data.
उत्तर
| Number of two wheelers |
Number of families |
| 0 | 3 |
| 1 | 28 |
| 2 | 14 |
| 3 | 4 |
| 4 | 1 |
Scale: 1 unit length = 2 two wheelers
APPEARS IN
संबंधित प्रश्न
Define the following term:
Observations
Define the following term:
Discrete frequency distribution
Define the following term:
Class limits
Following figures relate to the weekly wages (in Rs) of 15 workers in a factory:
300, 250, 200, 250, 200, 150, 350, 200, 250, 200, 150, 300, 150, 200, 250
Prepare a frequency table.
(i) What is the range in wages (in Rs)?
(ii) How many workers are getting Rs 350?
(iii) How many workers are getting the minimum wages?
The marks scored by 40 students of class VIII in mathematics are given below:
81, 55, 68, 79, 85, 43, 29, 68, 54, 73, 47, 35, 72, 64, 95, 44, 50, 77, 64, 35, 79, 52, 45, 54, 70, 83, 62, 64, 72, 92, 84, 76, 63, 43, 54, 38, 73, 68, 52, 54.
Prepare a frequency distribution with class size of 10 marks.
The monthly wages of 30 workers in a factory are given below:
830, 835, 890, 810, 835, 836, 869, 845, 898, 890, 820, 860, 832, 833, 855, 845, 804, 808, 812, 840, 885, 835, 836, 878, 840, 868, 890, 806, 840, 890.
Represent the data in the form of a frequency distribution with class size 10.
Construct a frequency table with equal class intervals from the following data on the monthly wages (in rupees) of 28 labourers working in a factory, taking one of the class intervals as 210-230 (230 not included):
220, 268, 258, 242, 210, 268, 272, 242, 311, 290, 300, 320, 319, 304, 302, 318, 306, 292, 254, 278, 210, 240, 280, 316, 306, 215, 256, 236.
The table shows the number of calls recorded by a Fire Service Station in one year.
| Types of Calls | Tally Marks | Frequency |
| Building Fires | |||| | | |
| Other Fires | |||| |||| | | |
| Hazardous Materials | 7 | |
| Rescues | 4 | |
| False Alarms | |||| || | |
| Total | ||
Complete the table and answer the following questions.
(i) Which type of call was recorded the most?
(ii) Which type of call was recorded the least?
(iii) How many calls were recorded in all?
(iv) How many calls were recorded as False Alarms?
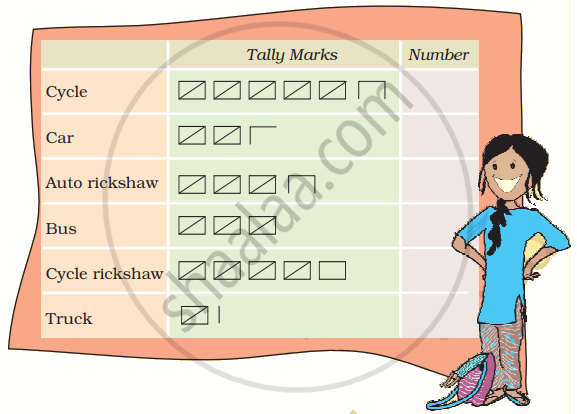
Sumita stood on the road for half an hour and counted the number of vehicles passing by. She made a tally mark for each vehicle. This helped her in counting the total number of vehicles in each group.

- Write the number of each vehicle in the table.
- How many vehicles in all did Sumita see on the road in half an hour?
- Auto rickshaws are thrice the number of trucks — true/false?
- Make tally marks for 7 more buses and 2 more trucks.
Catherine threw a dice 40 times and noted the number appearing each time as shown below:
| 1 | 3 | 5 | 6 | 6 | 3 | 5 | 4 | 1 | 6 |
| 2 | 5 | 3 | 4 | 6 | 1 | 5 | 5 | 6 | 1 |
| 1 | 2 | 2 | 3 | 5 | 2 | 4 | 5 | 5 | 6 |
| 5 | 1 | 6 | 2 | 3 | 5 | 2 | 4 | 1 | 5 |
Make a table and enter the data using tally marks. Find the number that appeared.
The minimum number of times
