Advertisements
Advertisements
प्रश्न
Observe the following graphs and answer the questions given below them:


(1) What do the above graphs show?
(2) Which country has highest male population?
(3) Which country has highest female population?
(4) Which country has rapid increase in female population after 2001?

(5) What was the female population in India in 1961?
(6) Which country has more than 1000 female population?
उत्तर
1) The above graphs show the sex ratio of Brazil and India.
2) India has highest male population.
3) Brazil has highest female population.
4) Brazil has rapid increase in female population after 2001.
5) The female population was 940 in India in 1961.
6) Brazil has more than 1000 female population.
APPEARS IN
संबंधित प्रश्न
Answer the following in detail.
Explain - The growth rate of population in India is decreasing but population is increasing.
Read the following graph and answer the questions
India and Brazil Literacy Rate (%)
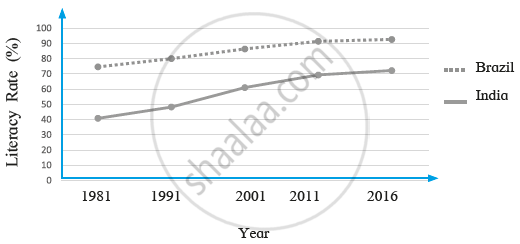
i) What was the literacy rate in Brazil in 2001?
ii) In which decade did the literacy rate increase the most in India?
iii) What is the difference between the literacy rates of India and Brazil in 1991?
iv) By how much has the literacy rate increased in India between 1981- 2016?
v) How much is the interval generally used in the graph?
vi) What conclusions can you draw from the graph regarding the literacy rates of India and Brazil?
With the help of given statistical data prepare a simple bar graph and answer the following questions:
India – Trend of Urbanisation (1961-2011)
| Year | Percentage of Urban Population |
| 1961 | 18.0 |
| 1971 | 18.2 |
| 1981 | 23.3 |
| 1991 | 25.7 |
| 2001 | 27.8 |
| 2011 | 31.2 |
(1) What is the interval of the data?
(2) Which decade shows slow rate of urbanisation?
(3) Which decade shows high rate of urbanisation?
Classify the factors affecting the distribution of population into favourable and unfavourable. Nearness to sea, lack of roads, temperate climate, lack of industries, new cities and towns, tropical moist forests, minerals, semi-arid climate, cultivable land.
Explain the similarities and differences between the population distribution in Brazil and India.
Distinguish between
Average life expectancy in India and Brazil
Observe the following graph and answer the questions given below-
Brazil- % of population (2016)

- Which type of graph is this?
- Which age group has the highest population?
- Write class interval of age groups given on Y-axis.
- Whose number is more in males and females of age above 60?
- How much percent of females are found in age group of 55 to 59 years?
- After which age group is the decrease in population found?
Observe the following graph and answer the given questions:
Life Expectancy :

- What is the average life expectancy in India in the year 2016?
- In the year 1990, how much was an increase in life expectancy in Brazil as compared to India ?
- How much was the average life expectancy in 1980 in India, during which year do you find the same in Brazil ?
- Which country shows an increase in life expectancy during the period from 2010 to 2016 ?
- In which country do you find high life expectancy ?
- By how much was India's life expectancy lesser than Brazil in the year 1960?
Is there a relationship between increase in life expectancy and growth of population? If yes, how?
If the proportion of dependent age groups increases in the composition of population, how will it affect the economy of a country?
