Advertisements
Advertisements
प्रश्न
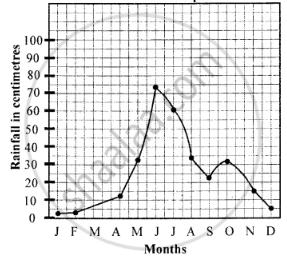
Prepare the rainfall graph of the data given below and answer the questions that follow :
| Jan. | Feb. | Mar. | Apr. | May | June | July | Aug. | Sep. | Oct. | Nov. | Dec. | |
| Temp(°C) | 26.9 | 27.6 | 28.7 | 29.1 | 28.4 | 26.5 | 25.9 | 26.0 | 26.4 | 26.8 | 27.1 | 26.9 |
| Rainfall mm | 22.2 | 25.4 | 48.7 | 128.5 | 326.3 | 741.3 | 610.4 | 348.7 | 249.0 | 316.9 | 159.8 | 47.4 |
(a) What is the average annual temperature?
(b) Calculate the annual range of temperature.
(c) In which climate type is this station?
उत्तर
(a) Average annual temperature is 27.2°C. (26.9 + 27.6 + 28.7 + 29.1 + 28.4 + 26.5 + 25.9 + 26.0 + 26.4 + 26.8 + 27.1 + 26.9) ÷ 12 = 326.3 ÷ 12 = 27.2
(b) Range of temperature is 3.2° C. 29.1 – 25.9 = 3.2
(c) The climatic type is equatorial climate.
| Jan. | Feb. | Mar. | Apr. | May | June | July | Aug. | Sep. | Oct. | Nov. | Dec. | |
| Temp(°C) | 26.9 | 27.6 | 28.7 | 29.1 | 28.4 | 26.5 | 25.9 | 26.0 | 26.4 | 26.8 | 27.1 | 26.9 |
| Rainfall mm | 22.2 | 25.4 | 48.7 | 128.5 | 326.3 | 741.3 | 610.4 | 348.7 | 249.0 | 316.9 | 159.8 | 47.4 |
| cm | 2.2 | 2.5 | 4.8 | 12.8 | 32.6 | 74.6 | 61.0 | 34.8 | 24.9 | 31.6 | 15.9 | 4.7 |
Rainfall Graph

APPEARS IN
संबंधित प्रश्न
What is the temperature range in winter of the Cool Continental Climate Type?
Name the areas of the Cool Temperate Ocean type climate
Give a reason for the following:
Deciduous trees shed their leaves in the dry season.
Give a reason for the following:
Patagonia is a desert in the rain shadow of the Andes.
Why are coal and petroleum called fossil fuels?
name five resources which we get from the earth.
Which places in India can be used for tidal power generation?
What is the hydrological cycle?
Define the Mangrove forest.
What are the characteristics of the Monsoon region?
