Advertisements
Advertisements
Question
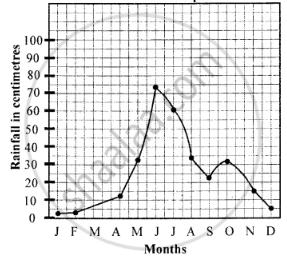
Prepare the rainfall graph of the data given below and answer the questions that follow :
| Jan. | Feb. | Mar. | Apr. | May | June | July | Aug. | Sep. | Oct. | Nov. | Dec. | |
| Temp(°C) | 26.9 | 27.6 | 28.7 | 29.1 | 28.4 | 26.5 | 25.9 | 26.0 | 26.4 | 26.8 | 27.1 | 26.9 |
| Rainfall mm | 22.2 | 25.4 | 48.7 | 128.5 | 326.3 | 741.3 | 610.4 | 348.7 | 249.0 | 316.9 | 159.8 | 47.4 |
(a) What is the average annual temperature?
(b) Calculate the annual range of temperature.
(c) In which climate type is this station?
Solution
(a) Average annual temperature is 27.2°C. (26.9 + 27.6 + 28.7 + 29.1 + 28.4 + 26.5 + 25.9 + 26.0 + 26.4 + 26.8 + 27.1 + 26.9) ÷ 12 = 326.3 ÷ 12 = 27.2
(b) Range of temperature is 3.2° C. 29.1 – 25.9 = 3.2
(c) The climatic type is equatorial climate.
| Jan. | Feb. | Mar. | Apr. | May | June | July | Aug. | Sep. | Oct. | Nov. | Dec. | |
| Temp(°C) | 26.9 | 27.6 | 28.7 | 29.1 | 28.4 | 26.5 | 25.9 | 26.0 | 26.4 | 26.8 | 27.1 | 26.9 |
| Rainfall mm | 22.2 | 25.4 | 48.7 | 128.5 | 326.3 | 741.3 | 610.4 | 348.7 | 249.0 | 316.9 | 159.8 | 47.4 |
| cm | 2.2 | 2.5 | 4.8 | 12.8 | 32.6 | 74.6 | 61.0 | 34.8 | 24.9 | 31.6 | 15.9 | 4.7 |
Rainfall Graph
APPEARS IN
RELATED QUESTIONS
What is the temperature range in winter of the Cool Continental Climate Type?
Give a reason for the following:
Patagonia is a desert in the rain shadow of the Andes.
What happens when fossil fuels are burnt?
What is the hydrological cycle?
Name any four countries which have monsoon climate.
What kind of climate does Steppe have?
Give the location of China type climate region.
By which currents are the coastal parts of China type of climate affected?
Give reasons for the following:
Camel is called the ship of the desert.
Long Answer Question:
Elaborate on the special features of vegetation in the hot desert region.
