Advertisements
Advertisements
प्रश्न
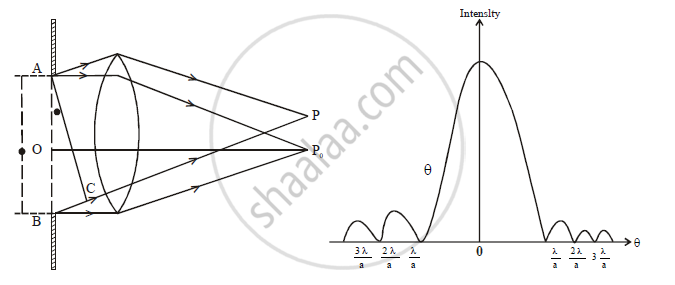
Show graphically the intensity distribution in Fraunhofer's single slit diffraction experiment. Label the axes.
उत्तर
Fraunhofer diffraction due to a single slit: Consider a monochromatic parallel beam of light of the wavelength `lambda` falling on a narrow slit of width `a` as shown in the figure. A diffraction pattern is formed on the screen placed in the focal plane of the convex lens. Let `O` be the centre of the slit and `P_o` be the central
point of the screen. The rays extending from the slit on either side `OP_o` are at equal optical paths from `P_o` The maximum intensity is observed at central point `P_o`. It is called the principal maximum.

As `theta` increases, the intensity changes between alternate minima and maxima.
The condition for minima is `a sin theta = nlambda` where n = 1,2,3,4....
The condition for minima is `a sin theta = (2n + 1)lambda"/"2` where n = 1,2,3,4....
APPEARS IN
संबंधित प्रश्न
What is 'diffraction of light'
A point is situated at 7cm and 7·2 cm from two coherent sources. Find the· nature of illumination at the point if wavelength of light is 4000A.
Monochromatic light of wavelength 4300 Å falls on a slit of width ‘a’. For what value of ‘a’ the first maximum falls at 30° ?
Wavelength of light of frequency 100 Hz is
The penetration of light into the region of geomaterial shadow is called.
The magnifying power of a telescope in normal adjustment is 24, when the length of the telescope tube 1 meter. The focal length of the eye lens is
Diffraction effects are easy to notice in the case of sound waves than in case of light waves because
Draw the graph showing intensity distribution of fringes with phase angle due to diffraction through a single slit. What is the width of the central maximum in comparison to that of a secondary maximum?
How can you differentiate whether a pattern is produced by a single slit or double slit?
In a diffraction pattern due to a single slit, how will the angular width of the central maximum change, if the slit width is decreased?
Justify your answer.
