Advertisements
Advertisements
प्रश्न
Show graphically the intensity distribution in Fraunhofer's single slit diffraction experiment. Label the axes.
उत्तर
Fraunhofer diffraction due to a single slit: Consider a monochromatic parallel beam of light of the wavelength
point of the screen. The rays extending from the slit on either side
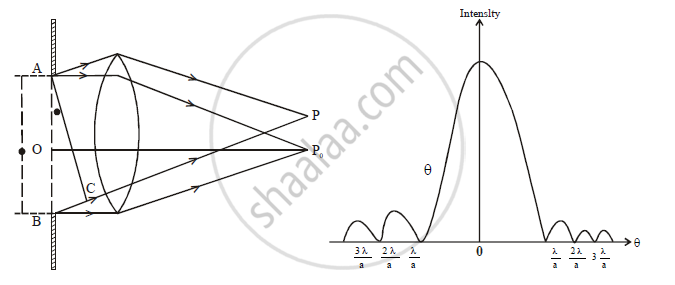
As
The condition for minima is
The condition for minima is
APPEARS IN
संबंधित प्रश्न
What is 'diffraction of light'
Describe briefly how a diffraction pattern is obtained on a screen due to a single narrow slit illuminated by a monochromatic source of light. Hence obtain the conditions for the angular width of secondary maxima and secondary minima.
In Fraunhofer diffraction, how is the angular width of the central bright fringe affected when slit separation is increased?
What should be the order of obstacle or aperture for diffraction of light?
The penetration of light into the region of geomaterial shadow is called.
Write two points of difference between an interference pattern and a diffraction pattern.
How can you differentiate whether a pattern is produced by a single slit or double slit?
In a diffraction pattern due to a single slit, how will the angular width of the central maximum change, if the screen is moved closer to the slit?
Justify your answer.
In a single slit Fraunhofer diffraction experiment, how does the angular width of the central maximum change when the slit width is Increased?
Draw a labelled graph showing the variation in intensity of diffracted light with diffracting angle in a single slit Fraunhofer diffraction experiment.
