Advertisements
Advertisements
प्रश्न
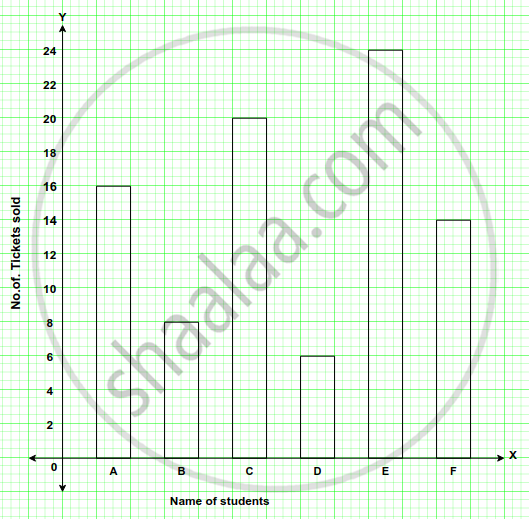
The bar graph drawn below shows the number of tickets sold during a fair by 6 students A, B, C, D, E and F.

Using the Bar graph, answer the following question:
What is the average number of tickets sold per student?
आलेख
एका वाक्यात उत्तर
उत्तर
Average Number of tickets sold per student
`= "Tickets sold by A + B + C + D + E + F"/6`
`= (16 + 9 + 20 + 7 + 24 + 14)/6`
`= 90/6`= 15 tickets
shaalaa.com
या प्रश्नात किंवा उत्तरात काही त्रुटी आहे का?
