Advertisements
Chapters
2: Estimation
3: Numbers in India and International System (With Comparison)
4: Place Value
5: Natural Numbers and Whole Numbers (Including Patterns)
6: Negative Numbers and Integers
7: Number Line
8: HCF and LCM
9: Playing with Numbers
10: Sets
11: Ratio
12: Proportion (Including Word Problems)
13: Unitary Method
14: Fractions
15: Decimal Fractions
16: Percent (Percentage)
17: Idea of Speed, Distance and Time
18: Fundamental Concepts of algebra
19: Fundamental Operations (Related to Algebraic Expressions)
20: Substitution (Including Use of Brackets as Grouping Symbols)
21: Framing Algebraic Expressions (Including Evaluation)
22: Simple (Linear) Equations (Including Word Problems)
23: Fundamental Concepts geometry
24: Angles (With their Types)
25: Properties of Angles and Lines (Including Parallel Lines)
26: Triangles (Including Types, Properties and Constructions)
27: Quadrilateral
28: Polygons
29: The Circle
30: Revision Exercise Symmetry (Including Constructions on Symmetry)
31: Recognition of Solids
32: Perimeter and Area of Plane Figures
▶ 33: Data Handling (Including Pictograph and Bar Graph)
34: Mean and Median
![Selina solutions for Mathematics [English] Class 6 chapter 33 - Data Handling (Including Pictograph and Bar Graph) Selina solutions for Mathematics [English] Class 6 chapter 33 - Data Handling (Including Pictograph and Bar Graph) - Shaalaa.com](/images/mathematics-english-class-6_6:44f3c4f6e33345f4bf41a86d406bf37f.jpg)
Advertisements
Solutions for Chapter 33: Data Handling (Including Pictograph and Bar Graph)
Below listed, you can find solutions for Chapter 33 of CISCE Selina for Mathematics [English] Class 6.
Selina solutions for Mathematics [English] Class 6 33 Data Handling (Including Pictograph and Bar Graph) Exercise 33 (A)
Marks scored by 30 students of class VI are as given below:
38, 46, 33, 45, 63, 53, 40, 85, 52, 75, 60, 73, 62, 22, 69, 43, 45, 33, 47, 41, 29, 43, 37, 49, 83, 44, 55, 22, 35 and 45. State:
(i) the highest marks scored.
(ii) the lowest marks scored.
(iii) the range of marks.
For the following raw data, form a discrete frequency distribution:
30, 32, 32, 28, 34, 34, 32, 30, 30, 32, 32, 34, 30, 32, 32, 28, 32, 30, 28, 30, 32, 32, 30, 28 and 30.
Define: data
Define the following term:
Frequency of an observation
Rearrange the following raw data in descending order:
5.3, 5.2, 5.1, 5.7, 5.6, 6.0, 5.5, 5.9, 5.8, 6.1, 5.5, 5.8, 5.7, 5.9 and 5.4. Then write the:
(i) highest value
(ii) lowest value
(iii) range of values
Represent the following data in the form of a frequency distribution:
52, 56, 72, 68, 52, 68, 52, 68, 52, 60, 56, 72, 56, 60, 64, 56, 48, 48, 64 and 64
In a study of number of accidents per day, the observations for 30 days were obtained as follows:
| 6 | 3 | 5 | 6 | 4 | 3 | 2 | 5 | 4 | 2 |
| 4 | 0 | 5 | 3 | 6 | 1 | 5 | 5 | 2 | 6 |
| 2 | 1 | 2 | 2 | 0 | 5 | 4 | 6 | 1 | 6 |
Construct a suitable frequency distribution table.
The following data represents the weekly wages (in ₹) of 15 workers in a factory:
900, 850, 800, 850, 800, 750, 950, 900, 950, 800, 750, 900, 750, 800 and 850.
Prepare a frequency distribution table. Now find,
(i) how many workers are getting less than ₹850 per week?
(ii) how many workers are getting more than ₹800 per week?
Using the data, given below, construct a frequency distribution table:
9, 17, 12, 20, 9, 18, 25, 17, 19, 9, 12, 9, 12, 18, 17, 19, 20, 25, 9 and 12.
Now answer the following:
(i) How many numbers are less than 19?
(ii) How many numbers are more than 20?
(iii) Which of the numbers, given above, is occurring most frequently?
Using the following data, construct a frequency distribution table:
46, 44, 42, 54, 52, 60, 50, 58, 56, 62, 50, 56, 54, 58 and 48.
Now answer the following:
- What is the range of the numbers?
- How many numbers are greater than 50?
- How many numbers are between 40 and 50?
Selina solutions for Mathematics [English] Class 6 33 Data Handling (Including Pictograph and Bar Graph) Exercise 33 (B)
The sale of vehicles, in a particular city, during the first six months of the year 2016 is shown below:
| Month | Jan | Feb | March | April | May | June |
| Number of vehicles sold | 3000 | 2500 | 4000 | 1000 | 1500 | 3500 |
Draw a pictograph to represent the above data.
The following pictograph shows the number of cars sold by four dealers A, B, C and D in a city. Scale:  = 50 cars.
| Dealer | Number of cars |
| A |       |
| B |      |
| C |         |
| D |     |
Using the pictograph, drawn above, answer the following questions:
How many more cars have dealer A sold as compared to dealer D?
The following pictograph shows the number of cars sold by four dealers A, B, C and D in a city. Scale:  = 50 cars.
| Dealer | Number of cars |
| A |       |
| B |      |
| C |         |
| D |     |
Using the pictograph, drawn above, answer the following questions:
What is the total number of cars sold by all the dealers?
The following pictograph shows the number of watches manufactured by a factory, in a particular weeks.
| Day | Number of watches |
| Monday |         |
| Tuesday |            |
| Wednesday |       |
| Thursday |       |
| Friday |      |
| Saturday |         |
Scale:  = 100 watches
Find on which day was the least number of watches manufactured?
The following pictograph shows the number of watches manufactured by a factory, in a particular weeks.
| Day | Number of watches |
| Monday |         |
| Tuesday |            |
| Wednesday |       |
| Thursday |       |
| Friday |      |
| Saturday |         |
Scale:  = 100 watches
Find the total number of watches manufactured in the whole week?
The number of animals in five villages are as follows:
| Village | A | B | C | D | E |
| No. of. animals | 160 | 240 | 180 | 80 | 120 |
Prepare a pictograph of these animals using one symbol to represent 20 animals.
The following pictograph shows different subject books which are kept in a school library.
| Subject | Number of books |
| Hindi |         |
| English |          |
| Math |        |
| Science |       |
| History |     |
Taking symbol of one book = 50 books, find:
How many History books are there in the library?
The following pictograph shows different subject books which are kept in a school library.
| Subject | Number of books |
| Hindi |         |
| English |          |
| Math |        |
| Science |       |
| History |     |
Taking symbol of one book = 50 books, find:
How many Science books are there in the library?
The following pictograph shows different subject books which are kept in a school library.
| Subject | Number of books |
| Hindi |         |
| English |          |
| Math |        |
| Science |       |
| History |     |
Taking symbol of one book = 50 books, find:
Which books are maximum in number?
Selina solutions for Mathematics [English] Class 6 33 Data Handling (Including Pictograph and Bar Graph) Exercise 33 (C)
The following table gives the number of students in class VI in a school during the academic years 2011-2012 to 2015-2016.
| Academic years | 2011 - 12 | 2012 - 13 | 2013- 2014 | 2014- 2015 | 2015 - 16 |
| No. of. students | 80 | 120 | 130 | 150 | 180 |
Represent the above data by a bar graph.
The attendance of a particular class for the six days of a week are as given below:
| Day | Monday | Tuesday | Wednesday | Thursday | Friday | Saturday |
| Attendance | 48 | 44 | 40 | 36 | 39 | 43 |
Draw a suitable graph.
The total number of students present in class VI B, for the six days in a week were as given below. Draw a suitable bar graph.
| Day | Monday | Tuesday | Wednesday | Thursday | Friday | Saturday |
| No.of students presents | 40 | 30 | 35 | 25 | 10 | 20 |
The total number of students present in class VI B, for the six days in a week were as given below. Draw a suitable bar graph.
| Year | 1996 | 2001 | 2006 | 2011 | 2016 |
| Population in Lakh | 45 | 57 | 70 | 90 | 110 |
Represent the above information with the help of a suitable bar graph.
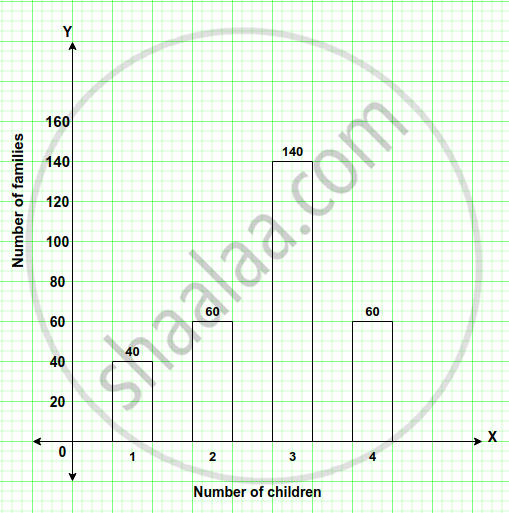
In a survey of 300 families of a colony, the number of children in each family was recorded and the data has been represented by the bar graph, given below:

Read the graph carefully and answer the following question:
How many families have 2 children each?
In a survey of 300 families of a colony, the number of children in each family was recorded and the data has been represented by the bar graph, given below:

Read the graph carefully and answer the following question:
How many families have no child?
In a survey of 300 families of a colony, the number of children in each family was recorded and the data has been represented by the bar graph, given below:

Read the graph carefully and answer the following question:
What percentage of families have 4 children?
Use the data, given in the following table, to draw’ a bar graph
| A | B | C | D | E | F |
| 250 | 300 | 225 | 350 | 275 | 325 |
Out of A, B, C, D, E and F
- Which has the maximum value.
- Which is greater A + D or B + E.
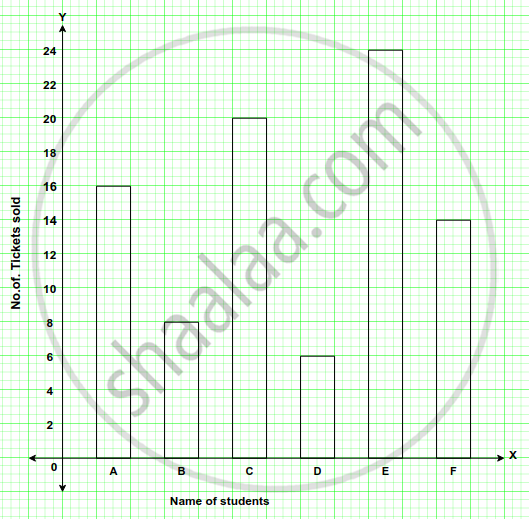
The bar graph drawn below shows the number of tickets sold during a fair by 6 students A, B, C, D, E and F.

Using the Bar graph, answer the following question:
Who sold the least number of tickets?
The bar graph drawn below shows the number of tickets sold during a fair by 6 students A, B, C, D, E and F.

Using the Bar graph, answer the following question:
Who sold the maximum number of tickets?
The bar graph drawn below shows the number of tickets sold during a fair by 6 students A, B, C, D, E and F.

Using the Bar graph, answer the following question:
How many tickets were sold by A, B and C taken together?
The bar graph drawn below shows the number of tickets sold during a fair by 6 students A, B, C, D, E and F.

Using the Bar graph, answer the following question:
How many tickets were sold by D, E and F taken together?
The bar graph drawn below shows the number of tickets sold during a fair by 6 students A, B, C, D, E and F.

Using the Bar graph, answer the following question:
What is the average number of tickets sold per student?
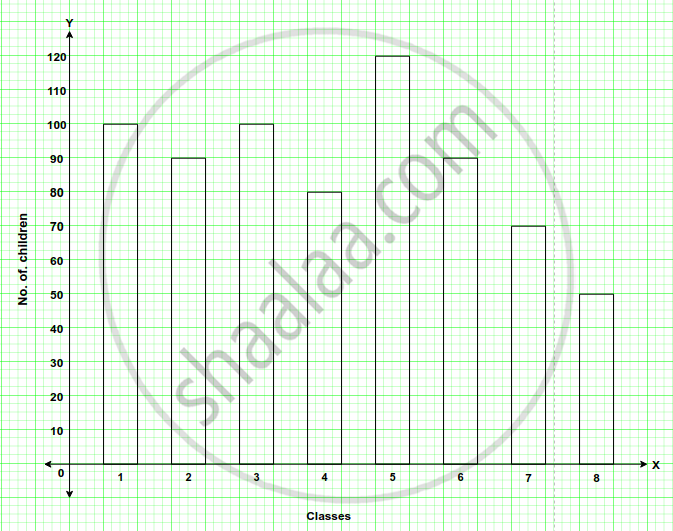
The following bar graph shows the number of children, in various classes, in a school in Delhi.

Using the given bar graph, find the number of children in each class.
The following bar graph shows the number of children, in various classes, in a school in Delhi.

Using the given bar graph, find the total number of children from Class 6 to Class 8.
The following bar graph shows the number of children, in various classes, in a school in Delhi.

Using the given bar graph, find how many more children there are in Class 5 compared to Class 6?
The following bar graph shows the number of children, in various classes, in a school in Delhi.

Using the given bar graph, find the total number of children from Class 1 to Class 8.
The following bar graph shows the number of children, in various classes, in a school in Delhi.

Using the given bar graph, find the average number of children in a class.
The column graph, given above, shows the number of patients, examined by Dr. V.K. Bansal, on different days of a particular week.
Use the graph to answer the following:
On which day were the maximum number of patients examined?
The column graph, given above, shows the number of patients, examined by Dr. V.K. Bansal, on different days of a particular week.
Use the graph to answer the following:
On which day were the least number of patients examined?
The column graph, given above, shows the number of patients, examined by Dr. V.K. Bansal, on different days of a particular week.
Use the graph to answer the following:
On which days were equal number or patients examined?
The column graph, given above, shows the number of patients, examined by Dr. V.K. Bansal, on different days of a particular week.
Use the graph to answer the following:
What is the total number of patients examined in the week?
A student spends his pocket money on various items, as given below:
Books: Rs. 380,
Postage: Rs. 30,
Cosmetics: Rs. 240,
Stationary: Rs. 220
and Entertainment: Rs. 120.
Draw a bar graph to represent his expenses.
Solutions for 33: Data Handling (Including Pictograph and Bar Graph)
![Selina solutions for Mathematics [English] Class 6 chapter 33 - Data Handling (Including Pictograph and Bar Graph) Selina solutions for Mathematics [English] Class 6 chapter 33 - Data Handling (Including Pictograph and Bar Graph) - Shaalaa.com](/images/mathematics-english-class-6_6:44f3c4f6e33345f4bf41a86d406bf37f.jpg)
Selina solutions for Mathematics [English] Class 6 chapter 33 - Data Handling (Including Pictograph and Bar Graph)
Shaalaa.com has the CISCE Mathematics Mathematics [English] Class 6 CISCE solutions in a manner that help students grasp basic concepts better and faster. The detailed, step-by-step solutions will help you understand the concepts better and clarify any confusion. Selina solutions for Mathematics Mathematics [English] Class 6 CISCE 33 (Data Handling (Including Pictograph and Bar Graph)) include all questions with answers and detailed explanations. This will clear students' doubts about questions and improve their application skills while preparing for board exams.
Further, we at Shaalaa.com provide such solutions so students can prepare for written exams. Selina textbook solutions can be a core help for self-study and provide excellent self-help guidance for students.
Concepts covered in Mathematics [English] Class 6 chapter 33 Data Handling (Including Pictograph and Bar Graph) are Collection of Data to Examine a Hypothesis, Concept of Pictograph, Collecting Data, Organisation of Data.
Using Selina Mathematics [English] Class 6 solutions Data Handling (Including Pictograph and Bar Graph) exercise by students is an easy way to prepare for the exams, as they involve solutions arranged chapter-wise and also page-wise. The questions involved in Selina Solutions are essential questions that can be asked in the final exam. Maximum CISCE Mathematics [English] Class 6 students prefer Selina Textbook Solutions to score more in exams.
Get the free view of Chapter 33, Data Handling (Including Pictograph and Bar Graph) Mathematics [English] Class 6 additional questions for Mathematics Mathematics [English] Class 6 CISCE, and you can use Shaalaa.com to keep it handy for your exam preparation.
