Advertisements
Advertisements
प्रश्न
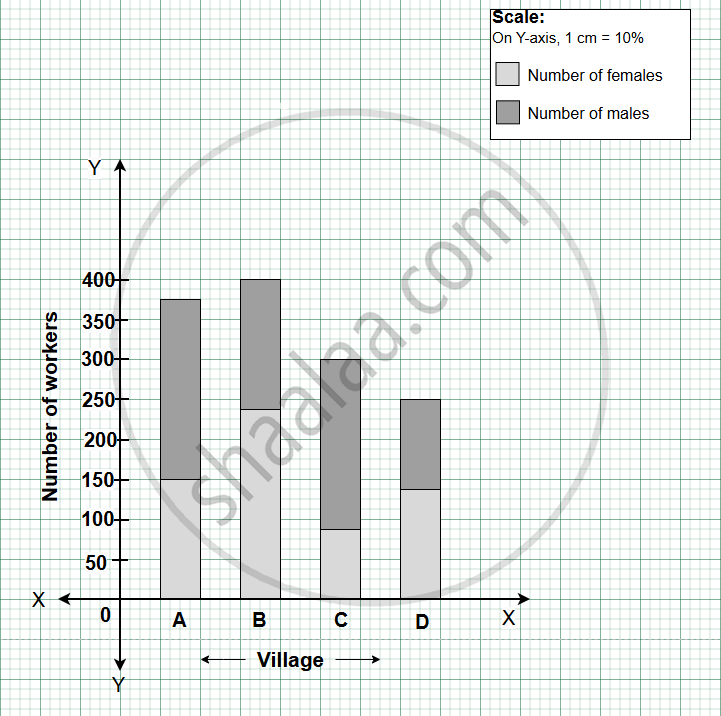
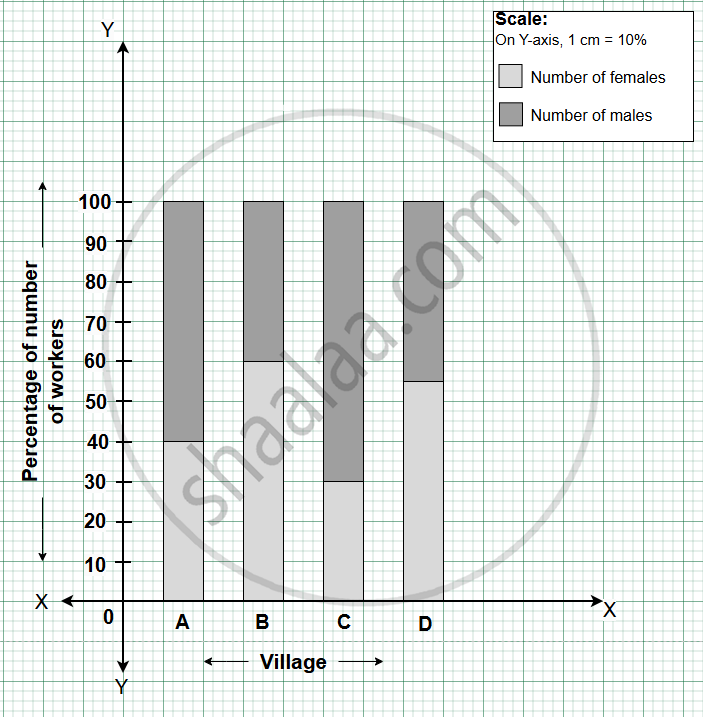
The following tables shows the number of male and female workers under employment gurantee scheme in villages A, B, C and D.
| Village | A | B | C | D |
| No. of females | 150 | 240 | 90 | 140 |
| No. of males | 225 | 160 | 210 | 110 |
- Show the information by a sub-divided bar diagram.
- Show the information by a percentage bar diagram.
आलेख
उत्तर
| Villages | A | B | C | D |
| No. of females | 150 | 240 | 90 | 140 |
| No. of males | 225 | 160 | 210 | 110 |
| Total | 375 | 400 | 300 | 250 |

| Villages | A | B | C | D |
| No. of females | 150 | 240 | 90 | 140 |
| No. of males | 225 | 160 | 210 | 110 |
| Total | 375 | 400 | 300 | 250 |
| Percentage of females | 40% | 60% | 30% | 56% |
| Percentage of males | 60% | 40% | 70% | 44% |

shaalaa.com
या प्रश्नात किंवा उत्तरात काही त्रुटी आहे का?
