Advertisements
Advertisements
प्रश्न
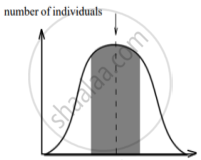
The graphs below show three types of natural selection. The shaded areas marked with arrows show the individuals in the population who are not selected. The dotted vertical lines show the statistical means.
 |
 |
 |
| character Graph A |
character Graph B |
character Graph C |
- What names are given to the types of selection shown in graphs A, B and C?
- After the selection has operated for several generations in the above populations indicated as, Graph A, B and C, graphically illustrate the probable results.
उत्तर
- A - stabilising; B - directional; C - disruptive;
- Graph A - Stabilising
Graph B - Directional
Graph C - Disruptive
APPEARS IN
संबंधित प्रश्न
Give the graphical representation of Hardy· Weinberg's principle in the form of Punnet Square.
Differentiate between Directional natural selection and Disruptive natural selection.
According to the Hardy-Weinberg principle, the allele frequency of a population remains constant. How do you interpret the change of frequency of alleles in a population?
How does the Hardy-Wienberg equation explain genetic equilibrium?
The factor that leads to the Founder effect in a population is ______
Gene flow occurs through generations. and can occur across language barriers in humans. If we have a technique of measuring specific allele frequencies in different population of the world, can we not predict human migratory patterns in pre-history and history? Do you agree or disagree? Provide explanation to your answer.
How is Hardy-Weinberg's expression “(p2 + 2pq + q2) = 1” derived?
Explain Hardy-Weinberg's principle
Write Hardy Weinberg's equation.
A population of 200 fruit flies is in Hardy Weinberg equilibrium. The frequency of the allele (a) 0.4. Calculate the following:
Frequency of the allele (A).
