Advertisements
Advertisements
प्रश्न
The velocity-displacement graph of a particle is shown in figure.
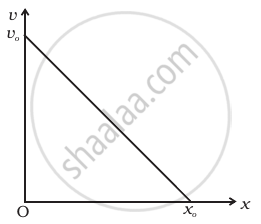
- Write the relation between v and x.
- Obtain the relation between acceleration and displacement and plot it.
उत्तर
a. Consider the point P(x, v) at any time t on the graph such that angle ABO is θ such that tan θ = `(AQ)/(QP) = ((v_0 -v))/x = v_0/x_0`
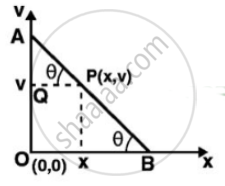
When the velocity decreases from v0 to zero during the displacement, the acceleration becomes negative.
`v_0 - v = (v_0/x_0)x`
`v = v_0(1 - x/x_0)`
Is the relation between v and x.
b. `a = (dv)/(dt) = ((dv)/(dt))((dx)/(dx)) = ((dv)/(dx)) ((dx)/(dt))`
`a = (- v_0)/(x_0) v`
`a = ((v_0^2)/(x_0^2))x - (v_0^2/x_0)`
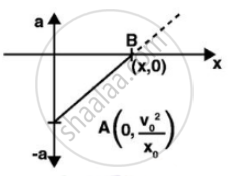
At `x = 0`
`a = (-v_0^2)/x_0`
At `a = 0`
`x = x_0`
The points are `(0, (-v_0^2)/x_0)` and `B(x_0, 0)`
APPEARS IN
संबंधित प्रश्न
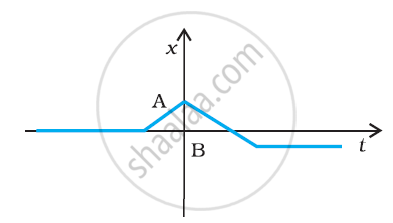
The figure shows the x-t plot of one-dimensional motion of a particle. Is it correct to say from the graph that the particle moves in a straight line for t < 0 and on a parabolic path for t > 0? If not, suggest a suitable physical context for this graph.
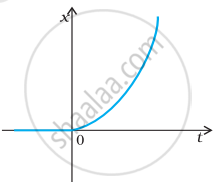
Suggest a suitable physical situation for the following graphs:
Two projectiles A and B are projected with angle of projection 15° for the projectile A and 45° for the projectile B. If RA and RB be the horizontal range for the two projectiles, then
A man has to go 50 m due north, 40 m due east and 20 m due south to reach a field. (a) What distance he has to walk to reach the field? (b) What is his displacement from his house to the field?
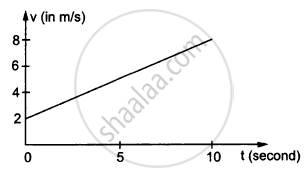
In the following figure Shows the graph of velocity versus time for a particle going along the X-axis. Find the acceleration
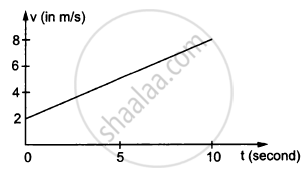
In the following figure Shows the graph of velocity versus time for a particle going along the X-axis. Find the distance travelled in 0 to 10s
Refer to the graphs in figure. Match the following.
| Graph | Characteristic |
(a) 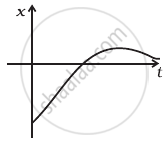 |
(i) has v > 0 and a < 0 throughout. |
(b) 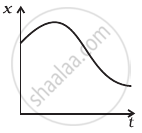 |
(ii) has x > 0 throughout and has a point with v = 0 and a point with a = 0. |
(c) 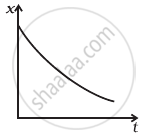 |
(iii) has a point with zero displacement for t > 0. |
(d) 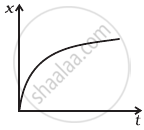 |
(iv) has v < 0 and a > 0. |
A ball is dropped and its displacement vs time graph is as shown figure (displacement x is from ground and all quantities are +ve upwards).
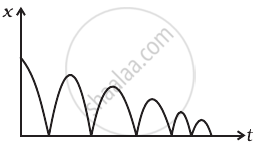
- Plot qualitatively velocity vs time graph.
- Plot qualitatively acceleration vs time graph.
A man runs across the roof-top of a tall building and jumps horizontally with the hope of landing on the roof of the next building which is of a lower height than the first. If his speed is 9 m/s, the (horizontal) distance between the two buildings is 10 m and the height difference is 9 m, will he be able to land on the next building? (take g = 10 m/s2)
A car covers the first half of the distance between two places at 40 km/h and other half at 60 km/h. The average speed of the car is ______.
