Advertisements
Advertisements
प्रश्न
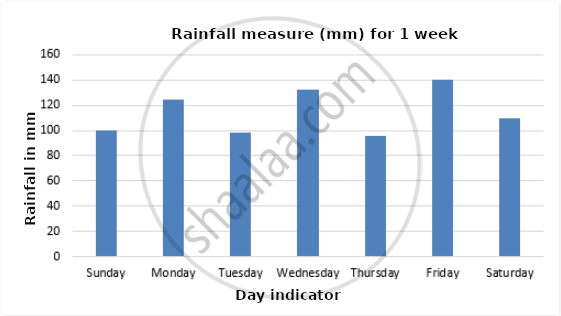
Using the rain gauge in your school, measure the rainfall continuously for one week occurring in your surroundings. Make a bar graph using computers to show the amount of rainfall on the basis of the data obtained.
उत्तर
The rainfall was monitored daily for one week in and around my school premises and the result obtained are presented in the form of the Bar Diagram Below.

APPEARS IN
संबंधित प्रश्न
Mention the different forms of precipitation.
The falling of water towards the earth surface from atmosphere in any form is known as ____________.
Write a short note on aquifer.
Write a short note on surface run-off.
Snowfall is common in the polar region and mountainous regions.
Explain the run-off.
______ refers to all forms of water that fall from clouds and reaches the earth’s Surface.
In freezing rain, the drops of water are usually greater than ______ in diameter.
The subsurface runoff is usually referred to as ______.
Identify the precipitation type with the help of the description given:
It never precipitates like this in equatorial areas. Precipitation in the solid form sometimes causes damage to the crops.
