Advertisements
Advertisements
Question
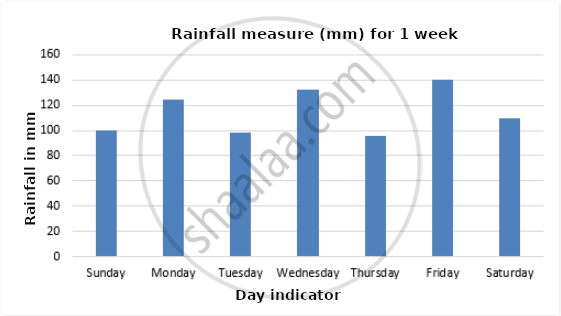
Using the rain gauge in your school, measure the rainfall continuously for one week occurring in your surroundings. Make a bar graph using computers to show the amount of rainfall on the basis of the data obtained.
Solution
The rainfall was monitored daily for one week in and around my school premises and the result obtained are presented in the form of the Bar Diagram Below.

APPEARS IN
RELATED QUESTIONS
Identify the precipitation type with the help of the description given:
It is the main source of the water that you use. Sometimes it is torrential and sometimes continuous. Most of the agriculture in India is dependent on it.
Define the following term:
Precipitation
The precipitation with the rain drop size of < 0.5 mm in diameter is known as _______________.
Snowfall is common in the polar region and mountainous regions.
Give a detailed explanation on different forms of precipitation.
______ is the downward movement of infiltrated water through soil and rock layers.
Hail forms only in ______ clouds during thunderstorms.
The percolation process represents the flow of water from ______ zone to the ______ zone.
Identify the precipitation type with the help of the description given:
It never precipitates like this in equatorial areas. Precipitation in the solid form sometimes causes damage to the crops.
Identify the odd man out:
