Advertisements
Advertisements
Question
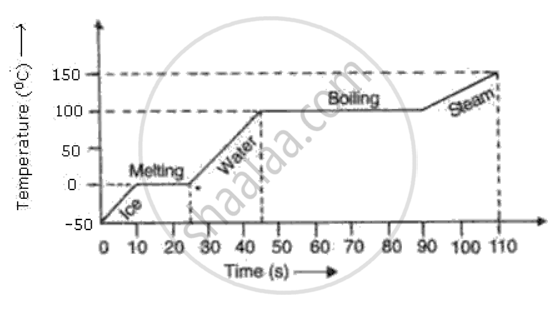
A slab of ice at -50°C is constantly heated till the steam attains a temperature of 150°C. Draw a graph showing the change of temperature with time. Label the various parts of graph properly.
Graph
Solution

shaalaa.com
Is there an error in this question or solution?
