Advertisements
Advertisements
Question
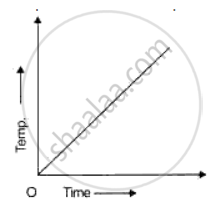
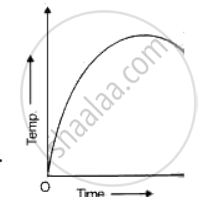
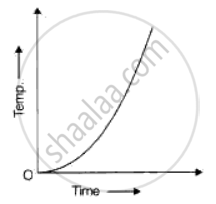
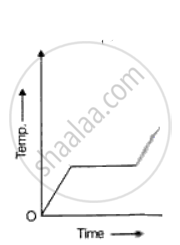
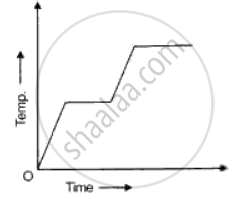
A solid is heated at a constant rate in an insulated container till half of it vaporizes. Which of the following graphs show the temperature changes during this time?
Options
MCQ
Solution

The first time when temperature is constant represents change of state from solid to liquid and the second time temperature is constant represents change of state from liquid to vapour.
shaalaa.com
Is there an error in this question or solution?
