English
Tamil Nadu Board of Secondary EducationHSC Science Class 12

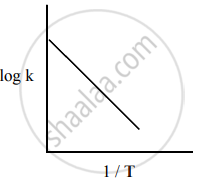
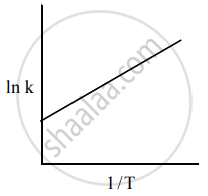
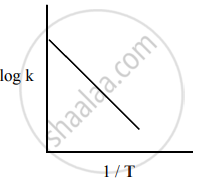
Among the following graphs showing variation of rate constant with temperature (T) for a reaction, the one that exhibits Arrhenius behavior over the entire temperature range is - Chemistry

Advertisements
Advertisements

Question

Among the following graphs showing the variation of rate constant with temperature (T) for a reaction, the one that exhibits Arrhenius behavior over the entire temperature range is

Options
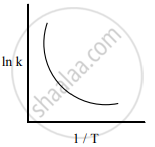
  • Both

    and

MCQ

Solution

shaalaa.com
Arrhenius Equation – the Effect of Temperature on Reaction Rate
  Is there an error in this question or solution?
Chapter 7: Chemical Kinetics - Evaluation [Page 226]

APPEARS IN

Samacheer Kalvi Chemistry - Volume 1 and 2 [English] Class 12 TN Board
Chapter 7 Chemical Kinetics
Evaluation | Q 3. | Page 226
Share
Notifications

Englishहिंदीमराठी


      Forgot password?
Use app×