Advertisements
Advertisements
Question
An individual and a population has certain characteristics. Name these attributes with definitions.
Solution
A population has certain attributes that an individual organism does not. An individual may have births and deaths, but a population has birth rates and death rates. In a population, these rates refer to per capita births and deaths, respectively. The rates, hence, expressed as change in numbers (increase or decrease) with respect to members of the population.
- Another attribute characteristic of a population is sex ratio. An individual is either a male or a female but a population has a sex ratio (e.g., 60 per cent of the population are females and 40 per cent males).
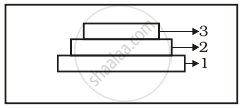
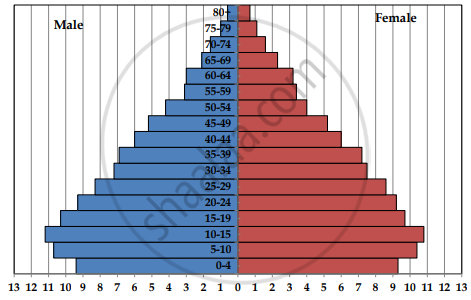
- A population at any given time is composed of individuals of different ages. If the age distribution (per cent individuals of a given age or age group) is plotted for the population, the resulting structure is called an age pyramid. For the human population, the age pyramids generally show the age distribution of males and females in a combined diagram. The shape of the pyramids reflects the growth status of the population.
- Whether it is growing
- Stable
- Declining

Representation of age pyramids for human population
APPEARS IN
RELATED QUESTIONS
(a) Name the two growth models that represent population growth and draw the respective growth curves they represent.
(b) State the basics for the difference in the shape of these curves
(c) Which one of the curves represents the human population growth at present? Do you think such a curve is sustainable? Give reason in support of your answer.
Construct an age pyramid which reflects a stable growth status of human population.
"Analysis of age-pyramids for human population can provide important inputs for long-term planning strategies." Explain.
Define the Carrying capacity.
Nutrient enrichment of water body result.
The density of a population in a habitat per unit area is measured in different units. Write the unit of measurement against the following:
Bacteria

What type of population growth is represented by the above age pyramid?
Given below is the Age Pyramid of the population in one of the states in India as per 2011 census. It depicts the male population on the left-hand side, female population on the right-hand side, newborns towards the base and gradually increasing age groups as we move from base to the top, with the oldest population at the top. Study this pyramid and comment upon the appropriateness of the Assertion and the Reason.

Percentage to the total population
Assertion: It is a stable population.
Reason: The pre-reproductive and reproductive individuals are almost in equal numbers and the post-reproductive individuals are relatively fewer.
Important attributes belonging to a population but not to an individual are:
- Birth rate and death rate
- Male and female
- Birth and death
- Sex-ratio
Select the correct option from the given options:
The number of lily plants in a pond was found to be 50. After one year, the number. increased to 65. Calculate the natality of lily plants.
