Advertisements
Advertisements
Question
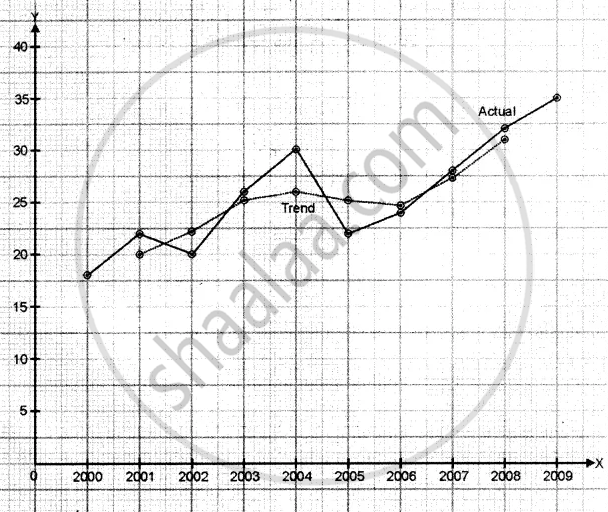
Construct 3 yearly moving averages from the following data and show on a graph against the original data:
| Year | 2000 | 2001 | 2002 | 2003 | 2004 | 2005 | 2006 | 2007 | 2008 | 2009 |
| Annual sales in lakhs | 18 | 22 | 20 | 26 | 30 | 22 | 24 | 28 | 32 | 35 |
Solution
| Year | Annual sale (in Lakhs) | 3 years moving sale | 3-year moving average |
| 2000 | 18 | --- | --- |
| 2001 | 22 | 60 | 20 |
| 2002 | 20 | 68 | 22.67 |
| 2003 | 26 | 76 | 25.33 |
| 2004 | 30 | 78 | 26 |
| 2005 | 22 | 76 | 25.33 |
| 2006 | 24 | 74 | 24.67 |
| 2007 | 28 | 84 | 28 |
| 2008 | 32 | 95 | 31.67 |
| 2009 | 35 | --- | --- |
APPEARS IN
RELATED QUESTIONS
The average cost function, AC for a commodity is given by AC = `x + 5 + 36/x` in terms of output x. Find
1) The total cost, C and marginal cost, MC as a function of x.
2) The outputs for which AC increases
The price of relatives and weights of a set of commodities are given below:
| Commodity | A | B | C | D |
| Price relatives | 125 | 120 | 127 | 119 |
| Weights | x | 2x | y | y + 3 |
If the sum of the weights is 40 and the weighted average of price relatives index number is 122, find the numerical values of x and y.
The cost function C(x) = 3x2 – 6x + 5. Find the average cost when x = 2.
The Average Cost function associated with producing and marketing x units of an item is given by AC = `x + 5 + 36/x`.
- Find the Total cost function.
- Find the range of values of x for which Average Cost is increasing.
Which condition is true if Average Cost (AC) is constant at all levels of output?
The cost function of a commodity is `C(x) = 200 + 20x - 1/2x^2` (in rupees). Find the range where AC falls.
