Advertisements
Advertisements
Question
Construct a combined histogram and frequency polygon for the following frequency distribution:
| Class-Intervals | 10 - 20 | 20 - 30 | 30 - 40 | 40 - 50 | 50 - 60 |
| Frequency | 3 | 5 | 6 | 4 | 2 |
Solution
Steps:
1. Draw a histogram for the given data.
2. Mark the mid-point at the top of each rectangle of the histogram drawn.
3. Also, mark the mid-point of the immediately lower class-interval and mid-point of the immediately higher class-interval.
4. Join the consecutive mid-point marked by straight lines to obtain the required frequency polygon.
5. The require combined histogram and frequency polygon are shown in the following figure:

APPEARS IN
RELATED QUESTIONS
The following table gives the life times of 400 neon lamps:-
| Life time (in hours) | Number of lamps |
| 300 - 400 | 14 |
| 400 - 500 | 56 |
| 500 - 600 | 60 |
| 600 - 700 | 86 |
| 700 - 800 | 74 |
| 800 - 900 | 62 |
| 900 - 1000 | 48 |
- Represent the given information with the help of a histogram.
- How many lamps have a life time of more than 700 hours?
Read the bar graph shown in Fig. 23.10 and answer the following questions
(i) What is the information given by the bar graph?
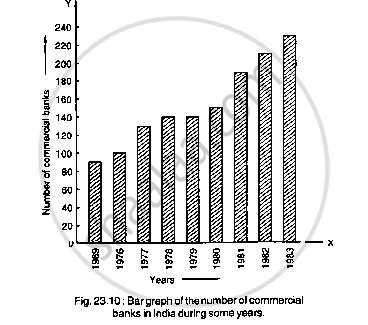
(ii) What was the number of commercial banks in 1977?
(iii) What is the ratio of the number of commercial banks in 1969 to that in 1980?
(iv) State whether true or false:
The number of commercial banks in 1983 is less than double the number of commercial banks in 1969.
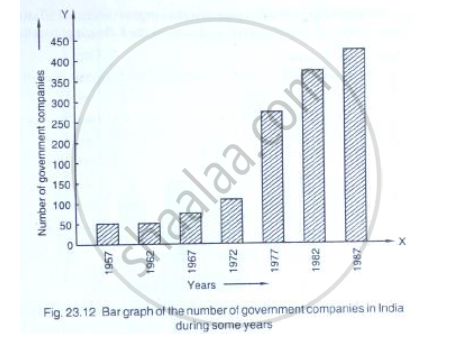
Read the following bar graph (Fig. 23.12) and answer the following questions:
(i) What is the information given by the bar graph?
(ii) State each of the following whether true or false.
a. The number of government companies in 1957 is that of 1982 is 1 :9.
b. The number of government companies have decreased over the year 1957 to 1983.
Read the bar graph given in Fig. 23.17 and answer the following questions:
(i) What information is given by the bar graph?
(ii) What was the crop-production of rice in 1970 - 71?
(iii) What is the difference between the maximum and minimum production of rice?

Read the bar graph given in Fig. 23.22 and answer the following questions:
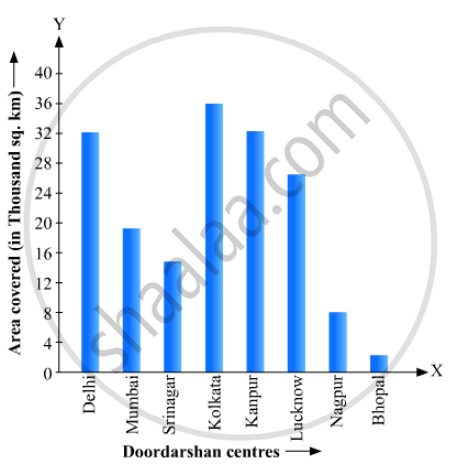
(i) What information is given by the bar graph?
(ii) Which Doordarshan centre covers maximum area? Also tell the covered area.
(iii) What is the difference between the areas covered by the centres at delhi and Bombay?
(iv) Which Doordarshan centres are in U.P State? What are the areas covered by them?
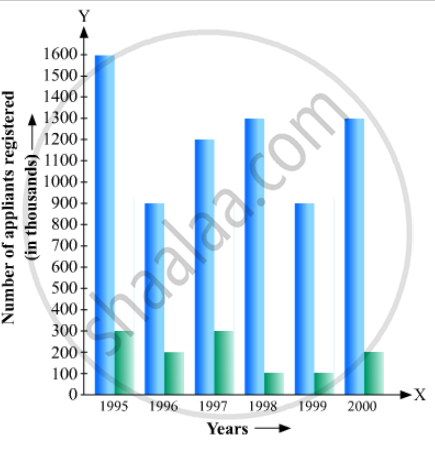
The following data gives the number (in thousands) of applicants registered with an
| Year | 1995 | 1996 | 1997 | 1998 | 1999 | 2000 |
| Number of applicants registered (in thousands) | 18 | 20 | 24 | 28 | 30 | 34 |
Construct a bar graph to represent the above data.
Draw a histogram for the daily earnings of 30 drug stores in the following table:
| Daily earning (in Rs): |
450-500 | 500-550 | 550-600 | 600-650 | 650-700 |
| Number of Stores: | 16 | 10 | 7 | 3 | 1 |
Construct a frequency polygon for the following distribution:
| Class-intervals | 0-4 | 4 - 8 | 8 - 12 | 12 - 16 | 16 - 20 | 20 - 24 |
| Frequency | 4 | 7 | 10 | 15 | 11 | 6 |
The expenditure of a family on different heads in a month is given below:
| Head | Food | Education | Clothing | House Rent | Others | Savings |
| Expenditure (in Rs) |
4000 | 2500 | 1000 | 3500 | 2500 | 1500 |
Draw a bar graph to represent the data above.
Draw a histogram to represent the following grouped frequency distribution:
| Ages (in years) | Number of teachers |
| 20 – 24 | 10 |
| 25 – 29 | 28 |
| 30 – 34 | 32 |
| 35 – 39 | 48 |
| 40 – 44 | 50 |
| 45 – 49 | 35 |
| 50 – 54 | 12 |
