Advertisements
Advertisements
Question
Read the bar graph given in Fig. 23.17 and answer the following questions:
(i) What information is given by the bar graph?
(ii) What was the crop-production of rice in 1970 - 71?
(iii) What is the difference between the maximum and minimum production of rice?

Solution
(1) The bar graph represents the production of rice crop in India in different years.
(2) According to the height of the 3rd bar from the left, the crop-production of rice in 1970-71 is 42.5 lakh tonnes.
(3) The maximum product of rice is 55 lakh tonnes (height of the 4th bar from the left) in the year 1980-81 and the minimum product of rice is 22 lakh tonnes (height of the 1st bar from the left) in the year 1950-51. Hence, the difference between maximum and minimum production of rice (in lakh tonnes) is = 55 – 22 = 33 .
APPEARS IN
RELATED QUESTIONS
Study the bar graph representing the number of persons in various age groups in a town shown in Fig. below. Observe the bar graph and answer the following questions:
(i) What is the percentage of the youngest age-group persons over those in the oldest age group?
(ii) What is the total population of the town?
(iii) What is the number of persons in the age group 60 - 65?
(iv) How many persons are more in the age-group 10 - 15 than in the age group 30 - 35?
(v) What is the age-group of exactly 1200 persons living in the town?
(vi) What is the total number of persons living in the town in the age-group 50 - 55?
(vii) What is the total number of persons living in the town in the age-groups 10 - 15 and 60 - 65?
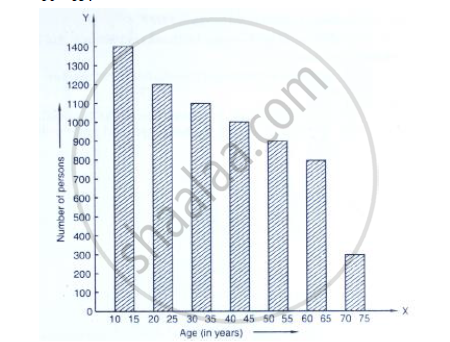
(viii) Whether the population in general increases, decreases or remains constant with the increase in the age-group.
The bar graph shown in Fig 23.16 represents the circulation of newspapers in 10 languages. Study the bar graph and answer the following questions:

(i) What is the total number of newspapers published in Hindi, English, Urdu, Punjabi and Bengali?
(ii) What percent is the number of news papers published in Hindi of the total number of newspapers?
(iii) Find the excess of the number of newspapers published in English over those published in Urdu.
(iv) Name two pairs of languages which publish the same number of newspapers.
(v) State the language in which the smallest number of newspapers are published.
(vi) State the language in which the largest number of newspapers are published.
(vii) State the language in which the number of newspapers published is between 2500 and 3500.
(viii) State whether true or false:
a. The number of newspapers published in Malayalam and Marathi together is less than those published in English.
b. The number of newspapers published in Telugu is more than those published in Tamil.
The following data gives the amount of loans (in crores of rupees) disbursed by a bank during some years:
| Year | 1992 | 1993 | 1994 | 1995 | 1996 |
| Loan (in crores of rupees) |
28 | 33 | 55 | 55 | 80 |
(i) Represent the above data with the help of a bar graph.
(ii) With the help of the bar graph, indicate the year in which amount of loan is not increased over that of the preceding year.
The following is the distribution of total household expenditure (in Rs.) of manual worker in a city:
| Expenditure (in Rs): |
100-150 | 150-200 | 200-250 | 250-300 | 300-350 | 350-400 | 400-450 | 450-500 |
| No. of manual workers: | 25 | 40 | 33 | 28 | 30 | 22 | 16 | 8 |
Draw a histogram and a frequency polygon representing the above data.
Which one of the following is not the graphical representation of statistical data:
In a histogram the class intervals or the group are taken along
The daily wages in a factory are distributed as follows:
|
Daily wages (in Rs.) |
125 - 175 |
175 - 225 |
225 - 275 |
275 - 325 |
325 - 375 |
|
Number of workers |
4 |
20 |
22 |
10 |
6 |
Draw a frequency polygon for this distribution.
The number of students (boys and girls) of class IX participating in different activities during their annual day function is given below:
| Activities | Dance | Speech | Singing | Quiz | Drama | Anchoring |
| Boys | 12 | 5 | 4 | 4 | 10 | 2 |
| Girls | 10 | 8 | 6 | 3 | 9 | 1 |
Draw a double bar graph for the above data.
Expenditure on Education of a country during a five year period (2002-2006), in crores of rupees, is given below:
| Elementary education | 240 |
| Secondary Education | 120 |
| University Education | 190 |
| Teacher’s Training | 20 |
| Social Education | 10 |
| Other Educational Programmes | 115 |
| Cultural programmes | 25 |
| Technical Education | 125 |
Represent the information above by a bar graph.
The marks obtained (out of 100) by a class of 80 students are given below:
| Marks | Number of students |
| 10 – 20 | 6 |
| 20 – 30 | 17 |
| 30 – 50 | 15 |
| 50 – 70 | 16 |
| 70 – 100 | 26 |
Construct a histogram to represent the data above.
