Advertisements
Advertisements
Question
The bar graph shown in Fig 23.16 represents the circulation of newspapers in 10 languages. Study the bar graph and answer the following questions:

(i) What is the total number of newspapers published in Hindi, English, Urdu, Punjabi and Bengali?
(ii) What percent is the number of news papers published in Hindi of the total number of newspapers?
(iii) Find the excess of the number of newspapers published in English over those published in Urdu.
(iv) Name two pairs of languages which publish the same number of newspapers.
(v) State the language in which the smallest number of newspapers are published.
(vi) State the language in which the largest number of newspapers are published.
(vii) State the language in which the number of newspapers published is between 2500 and 3500.
(viii) State whether true or false:
a. The number of newspapers published in Malayalam and Marathi together is less than those published in English.
b. The number of newspapers published in Telugu is more than those published in Tamil.
Solution
(1) The total number of news papers published in Hindi, English, Urdu, Punjabi and Bengali is
=3700+ 3400+ 700+ 200+ 1100
=9100.
(2) The total number of news papers published is
= 700 +400 +1000 + 200 +1400 +1400 + 700 +1100 +3400 +1100
=14,400
The number of news papers published in Hindi is 3700. The percentage of published Hindi news papers is
`3700/14400 xx 100`
`3700/144`
=25.7% .
(3) The number of news papers published in English and Urdu are 3400 and 700 respectively. Hence, the excess of the number of news papers published in English over those published in Urdu is
3400-700
=2700
(4) According to the length of the 5th and 6th bars from the top, the number of news papers published in Marathi and Malayalam are same. According to the length of the 1st and 3rd bars from the bottom, the number of news papers published in Bengali and Gujrati are same.
(5) According to the length of the 4th bar from the top, the smallest number of news papers published in the language Punjabi.
(6) According to the length of the 4th bar from the bottom, the largest number of news papers published in the language Hindi.
(7) The languages in which the number of published news papers is greater than or equal to 2500 are English and Hindi. Among the languages Hindi and English, the language in which the number of published news papers is less than or equal to 3500 is English. Hence, the language is English.
(8) (a) The number of news papers published in Malayalam and Marathi together is
1400+1400
=2800
The number of news papers published in English is 3400. Clearly, 2800 is less than 3400. Hence, the statement is true.
(b) The number of news papers published in Telugu and Tamil are 400 and 1000 respectively. Clearly 400is not greater than 1000. Hence, the statement is false.
APPEARS IN
RELATED QUESTIONS
100 surnames were randomly picked up from a local telephone directory and a frequency distribution of the number of letters in the English alphabet in the surnames was found as follows:
| Number of letters | Number of surnames |
| 1 - 4 | 6 |
| 4 - 6 | 30 |
| 6 - 8 | 44 |
| 8 - 12 | 16 |
| 12 - 20 | 4 |
- Draw a histogram to depict the given information.
- Write the class interval in which the maximum number of surnames lie.
Read the bar graph shown in Fig. 23.10 and answer the following questions
(i) What is the information given by the bar graph?
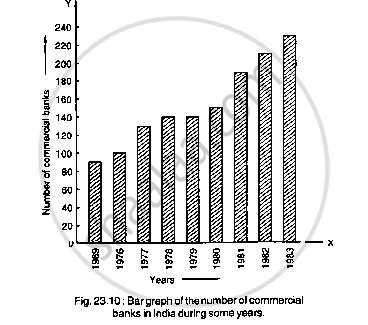
(ii) What was the number of commercial banks in 1977?
(iii) What is the ratio of the number of commercial banks in 1969 to that in 1980?
(iv) State whether true or false:
The number of commercial banks in 1983 is less than double the number of commercial banks in 1969.
Explain the reading and interpretation of bar graphs.
The production of saleable steel in some of the steel plants our country during 1999 is given below:
| Plant | Bhilai | Durgapur | Rourkela | Bokaro |
| Production (In thousand tonnes) |
160 | 80 | 200 | 150 |
Construct a bar graph to represent the above data on a graph paper by using the scale 1 big divisions = 20 thousand tonnes.
The following data gives the value (in crores of rupees) of the Indian export of cotton textiles for different years:
| Years | 1982 | 1983-1984 | 1984-1985 | 1985-1986 | 1986-1987 |
| Value of Export of Cotton Textiles (in crores of rupees) |
300 | 325 | 475 | 450 | 550 |
Represent the above data with the help of a bar graph. Indicate with the help of a bar graph the year in which the rate of increase in exports is maximum over the preceding year.
The percentage of marks obtained, in different subjects by Ashok Sharma (in an examination) is given below. Draw a bar graph to represent it.
| English | Hindi | Maths | Science | Social Studies |
| 85 | 60 | 35 | 50 | 70 |
Students of a small school use different modes of travel to school as shown below:
| Mode | Bus | Car | Bicycle | Auto | On foot |
| No. of students | 142 | 98 | 50 | 34 | 16 |
Draw a suitable bar graph.
The following table gives the frequencies of most commonly used letters a, e, i, o, r, t, u from a page of a book:
| Letters | a | e | i | o | r | t | u |
| Frequency | 75 | 125 | 80 | 70 | 80 | 95 | 75 |
Represent the information above by a bar graph.
The marks obtained (out of 100) by a class of 80 students are given below:
| Marks | Number of students |
| 10 – 20 | 6 |
| 20 – 30 | 17 |
| 30 – 50 | 15 |
| 50 – 70 | 16 |
| 70 – 100 | 26 |
Construct a histogram to represent the data above.
Following table shows a frequency distribution for the speed of cars passing through at a particular spot on a high way:
| Class interval (km/h) | Frequency |
| 30 – 40 | 3 |
| 40 – 50 | 6 |
| 50 – 60 | 25 |
| 60 – 70 | 65 |
| 70 – 80 | 50 |
| 80 – 90 | 28 |
| 90 – 100 | 14 |
Draw the frequency polygon representing the above data without drawing the histogram.
