Advertisements
Advertisements
प्रश्न
The bar graph shown in Fig 23.16 represents the circulation of newspapers in 10 languages. Study the bar graph and answer the following questions:

(i) What is the total number of newspapers published in Hindi, English, Urdu, Punjabi and Bengali?
(ii) What percent is the number of news papers published in Hindi of the total number of newspapers?
(iii) Find the excess of the number of newspapers published in English over those published in Urdu.
(iv) Name two pairs of languages which publish the same number of newspapers.
(v) State the language in which the smallest number of newspapers are published.
(vi) State the language in which the largest number of newspapers are published.
(vii) State the language in which the number of newspapers published is between 2500 and 3500.
(viii) State whether true or false:
a. The number of newspapers published in Malayalam and Marathi together is less than those published in English.
b. The number of newspapers published in Telugu is more than those published in Tamil.
उत्तर
(1) The total number of news papers published in Hindi, English, Urdu, Punjabi and Bengali is
=3700+ 3400+ 700+ 200+ 1100
=9100.
(2) The total number of news papers published is
= 700 +400 +1000 + 200 +1400 +1400 + 700 +1100 +3400 +1100
=14,400
The number of news papers published in Hindi is 3700. The percentage of published Hindi news papers is
`3700/14400 xx 100`
`3700/144`
=25.7% .
(3) The number of news papers published in English and Urdu are 3400 and 700 respectively. Hence, the excess of the number of news papers published in English over those published in Urdu is
3400-700
=2700
(4) According to the length of the 5th and 6th bars from the top, the number of news papers published in Marathi and Malayalam are same. According to the length of the 1st and 3rd bars from the bottom, the number of news papers published in Bengali and Gujrati are same.
(5) According to the length of the 4th bar from the top, the smallest number of news papers published in the language Punjabi.
(6) According to the length of the 4th bar from the bottom, the largest number of news papers published in the language Hindi.
(7) The languages in which the number of published news papers is greater than or equal to 2500 are English and Hindi. Among the languages Hindi and English, the language in which the number of published news papers is less than or equal to 3500 is English. Hence, the language is English.
(8) (a) The number of news papers published in Malayalam and Marathi together is
1400+1400
=2800
The number of news papers published in English is 3400. Clearly, 2800 is less than 3400. Hence, the statement is true.
(b) The number of news papers published in Telugu and Tamil are 400 and 1000 respectively. Clearly 400is not greater than 1000. Hence, the statement is false.
APPEARS IN
संबंधित प्रश्न
A random survey of the number of children of various age groups playing in a park was found as follows:
| Age (in years) | Number of children |
| 1 - 2 | 5 |
| 2 - 3 | 3 |
| 3 - 5 | 6 |
| 5 - 7 | 12 |
| 7 - 10 | 9 |
| 10 - 15 | 10 |
| 15 - 17 | 4 |
Draw a histogram to represent the data above.
The population of Delhi State in different census years is as given below:
| Census year | 1961 | 1971 | 1981 | 1991 | 2001 |
| Population in Lakhs | 30 | 55 | 70 | 110 | 150 |
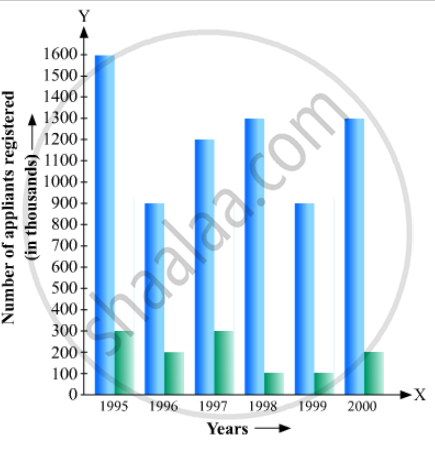
The following data gives the number (in thousands) of applicants registered with an
| Year | 1995 | 1996 | 1997 | 1998 | 1999 | 2000 |
| Number of applicants registered (in thousands) | 18 | 20 | 24 | 28 | 30 | 34 |
Construct a bar graph to represent the above data.
The production of saleable steel in some of the steel plants our country during 1999 is given below:
| Plant | Bhilai | Durgapur | Rourkela | Bokaro |
| Production (In thousand tonnes) |
160 | 80 | 200 | 150 |
Construct a bar graph to represent the above data on a graph paper by using the scale 1 big divisions = 20 thousand tonnes.
The following table gives the distribution of IQ's (intelligence quotients) of 60 pupils of class V in a school:
| IQ's: | 125.5 to 13.25 |
118.5 to 125.5 |
111.5 to 118.5 |
104.5 to 111.5 |
97.5 to 104.5 |
90.5 to 97.5 |
83.5 to 90.5 |
76.5 to 83.5 |
69.5 to 76.5 |
62.5 to 69.5 |
| No. of pupils: |
1 | 3 | 4 | 6 | 10 | 12 | 15 | 5 | 3 | 1 |
Draw a frequency polygon for the above data.
A frequency polygon is constructed by plotting frequency of the class interval and the
For the following data, draw a pie graph.
| Subject | Hindi | English | Maths | Science | Social Study |
| Marks as percent | 60 | 45 | 42 | 48 | 75 |
The birth rate thousand of the following states over a certain period is given below:
| States | Punjab | Haryana | U.P. | Gujarat | Rajasthan | Jammu and Kashmir |
| Birth Rate (per thousand ) | 22.9 | 21.8 | 19.5 | 21.1 | 23.9 | 18.3 |
Draw a bar graph for the above data.
Is it correct to say that in a histogram, the area of each rectangle is proportional to the class size of the corresponding class interval? If not, correct the statement.
Draw a histogram to represent the following grouped frequency distribution:
| Ages (in years) | Number of teachers |
| 20 – 24 | 10 |
| 25 – 29 | 28 |
| 30 – 34 | 32 |
| 35 – 39 | 48 |
| 40 – 44 | 50 |
| 45 – 49 | 35 |
| 50 – 54 | 12 |
