Advertisements
Advertisements
Question
Read the following bar graph(Fig. 23.15) and answer the following questions:
(i) What information is given by the bar graph?
(ii) What was the production of a student in the year 1980 - 81?
(iii) What is the minimum and maximum productions of cement and corresponding years?

Solution
i) It gives information regarding industrial production of cement in different years in India.
(ii) The production of cement in the year 1980 – 1981 = 186 lakh tones.
(iii) The minimum production is 30 lakh tones in 1950 – 1951 and maximum production 232 lakh tones in 1982 – 1983
APPEARS IN
RELATED QUESTIONS
A survey conducted by an organisation for the cause of illness and death among the women between the ages 15 - 44 (in years) worldwide, found the following figures (in %):-
| S.No. | Causes | Female fatality rate (%) |
| 1. | Reproductive health conditions | 31.8 |
| 2. | Neuropsychiatric conditions | 25.4 |
| 3. | Injuries | 12.4 |
| 4. | Cardiovascular conditions | 4.3 |
| 5. | Respiratory conditions | 4.1 |
| 6. | Other causes | 22.0 |
- Represent the information given above graphically.
- Which condition is the major cause of women’s ill health and death worldwide?
- Try to find out, with the help of your teacher, any two factors which play a major role in the cause in (ii) above being the major cause.
The following table gives the distribution of students of two sections according to the mark obtained by them:-
| Section A | Section B | ||
| Marks | Frequency | Marks | Frequency |
| 0 - 10 | 3 | 0 - 10 | 5 |
| 10 - 20 | 9 | 10 - 20 | 19 |
| 20 - 30 | 17 | 20 - 30 | 15 |
| 30 - 40 | 12 | 30 - 40 | 10 |
| 40 - 50 | 9 | 40 - 50 | 1 |
Represent the marks of the students of both the sections on the same graph by two frequency polygons. From the two polygons compare the performance of the two sections.
The bar graph shown in Fig 23.16 represents the circulation of newspapers in 10 languages. Study the bar graph and answer the following questions:

(i) What is the total number of newspapers published in Hindi, English, Urdu, Punjabi and Bengali?
(ii) What percent is the number of news papers published in Hindi of the total number of newspapers?
(iii) Find the excess of the number of newspapers published in English over those published in Urdu.
(iv) Name two pairs of languages which publish the same number of newspapers.
(v) State the language in which the smallest number of newspapers are published.
(vi) State the language in which the largest number of newspapers are published.
(vii) State the language in which the number of newspapers published is between 2500 and 3500.
(viii) State whether true or false:
a. The number of newspapers published in Malayalam and Marathi together is less than those published in English.
b. The number of newspapers published in Telugu is more than those published in Tamil.
Read the bar graph given in Fig. 23.17 and answer the following questions:
(i) What information is given by the bar graph?
(ii) What was the crop-production of rice in 1970 - 71?
(iii) What is the difference between the maximum and minimum production of rice?

Read the bar graph given in Fig. 23.22 and answer the following questions:
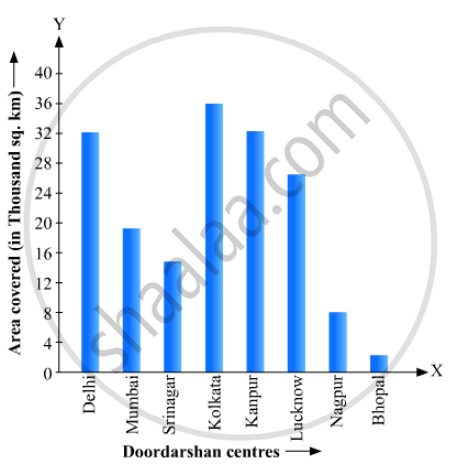
(i) What information is given by the bar graph?
(ii) Which Doordarshan centre covers maximum area? Also tell the covered area.
(iii) What is the difference between the areas covered by the centres at delhi and Bombay?
(iv) Which Doordarshan centres are in U.P State? What are the areas covered by them?
The following data gives the amount of loans (in crores of rupees) disbursed by a bank during some years:
| Year | 1992 | 1993 | 1994 | 1995 | 1996 |
| Loan (in crores of rupees) |
28 | 33 | 55 | 55 | 80 |
(i) Represent the above data with the help of a bar graph.
(ii) With the help of the bar graph, indicate the year in which amount of loan is not increased over that of the preceding year.
In a histogram the area of each rectangle is proportional to
In a histogram the class intervals or the group are taken along
Mr. Mirza’s monthly income is Rs. 7,200. He spends Rs. 1,800 on rent, Rs. 2,700 on food, Rs. 900 on the education of his children; Rs. 1,200 on Other things and saves the rest.
Draw a pie-chart to represent it.
The lengths of 62 leaves of a plant are measured in millimetres and the data is represented in the following table:
| Length (in mm) | Number of leaves |
| 118 – 126 | 8 |
| 127 – 135 | 10 |
| 136 – 144 | 12 |
| 145 – 153 | 17 |
| 154 – 162 | 7 |
| 163 – 171 | 5 |
| 172 – 180 | 3 |
Draw a histogram to represent the data above.
