Advertisements
Advertisements
Question
The following bar graph (Fig. 23. 1 4) represents the heights (in cm) of 50 students of Class XI of a particular school. Study the graph and answer the following questions:
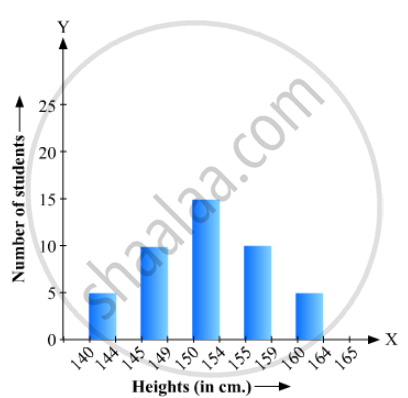
(i) What percentage of the total number of students have their heights more than 149cm?
(ii) How many students in the class are in the range of maximum height of the class?
(iii) The school wants to provide a particular type of tonic to each student below the height
of 150 cm to improve his height. If the cost of the tonic for each student comes out to be Rs. 55, how much amount of money is required?
(iv) How many students are in the range of shortest height of the class?
(v) State whether true or false:
a. There are 9 students in the class whose heights are in the range of 155 - 159 cm.
b. Maximum height (in cm) of a student in the class is 17.
c. There are 29 students in the class whose heights are in the range of 145- 154 cm.
d. Minimum height (in cm) of a student is the class is in the range of 140 – 144 cms.
e. The number of students in the class having their heights less than 150 cm is 12.
f. There are 14 students each of whom has height more than 154. cm.
Solution
(1) The total number of students is 50. The number of students having heights more than 149 cm is
Desired percentage is:
`=(17+9+5)/50 xx 100`
= 62%
(2) The maximum range of height is 164-165 cm. The number of students belonging to this group is 5.
(3) The number of students whose heights are less than 150 cm is 7 + 12 = 19. Hence, the total cost is 19 × 55= Rs 1045/-
(4) The minimum range of height is 140-144 cm. The number of students belonging to this group is 7.
(5) (a) The number of students whose heights are in the range 155-159 cm is 9. Hence, the statement is true.
(b) The maximum possible height (in cm) of a student in the class can be 164 cm. Hence, the statement is false.
(c) The number of students whose heights are in the range 145-154 cm is 12 +17 = 29 . Hence, the statement is true.
(d) The minimum range of heights of students in the class is 140-144 cm. Hence, the statement is true.
(e) The number of students having heights less than 150 cm is 7 +12+ 19 . Hence, the statement is false.
(f) The number of students having heights more than 154 cm is
9+5=14. Hence, the statement is true.
APPEARS IN
RELATED QUESTIONS
The following table gives the life times of 400 neon lamps:-
| Life time (in hours) | Number of lamps |
| 300 - 400 | 14 |
| 400 - 500 | 56 |
| 500 - 600 | 60 |
| 600 - 700 | 86 |
| 700 - 800 | 74 |
| 800 - 900 | 62 |
| 900 - 1000 | 48 |
- Represent the given information with the help of a histogram.
- How many lamps have a life time of more than 700 hours?
The following table gives the distribution of students of two sections according to the mark obtained by them:-
| Section A | Section B | ||
| Marks | Frequency | Marks | Frequency |
| 0 - 10 | 3 | 0 - 10 | 5 |
| 10 - 20 | 9 | 10 - 20 | 19 |
| 20 - 30 | 17 | 20 - 30 | 15 |
| 30 - 40 | 12 | 30 - 40 | 10 |
| 40 - 50 | 9 | 40 - 50 | 1 |
Represent the marks of the students of both the sections on the same graph by two frequency polygons. From the two polygons compare the performance of the two sections.
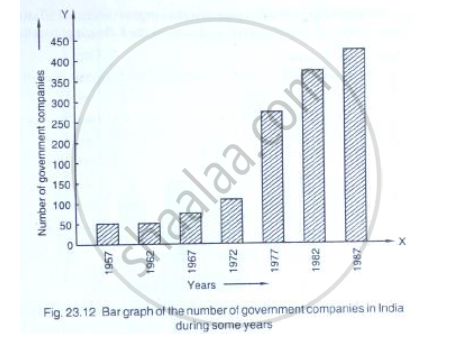
Read the following bar graph (Fig. 23.12) and answer the following questions:
(i) What is the information given by the bar graph?
(ii) State each of the following whether true or false.
a. The number of government companies in 1957 is that of 1982 is 1 :9.
b. The number of government companies have decreased over the year 1957 to 1983.
The following table gives the route length (in thousand kilometres) of the Indian Railways in some of the years:
| Year | 1960-61 | 1970-71 | 1980-81 | 1990-91 | 2000-2001 |
| Route length (in thousand km) |
56 | 60 | 61 | 74 | 98 |
Represent the above data with the help of a bar graph.
The following data gives the demand estimates of the Government of India, Department of Electronics for the personnel in the Computer sector during the Eighth Plan period (1990-95):
| Qualifications: | MCA (Master in Computer applications) |
DCA (Diploma in Computer Applications) |
DCE (Diploma in Computer Engineering) |
CL (Certificate Level Course) |
ST (Short-term Course) |
| Personnel Required | 40600 | 181600 | 18600 | 670600 | 1802900 |
Represent the data with the help of a bar graph. Indicate with the help of the bar graph the course where estimated requirement is least.
Construct a histogram for the following data:
| Monthly School fee (in Rs): |
30-60 | 60-90 | 90-120 | 120-150 | 150-180 | 180-210 | 210-240 |
| No of Schools | 5 | 12 | 14 | 18 | 10 | 9 | 4 |
The time taken, in seconds, to solve a problem by each of 25 pupils is as follows:
16, 20, 26, 27, 28, 30, 33, 37, 38, 40, 42, 43, 46, 46, 46, 48, 49, 50, 53, 58, 59, 60, 64, 52, 20
(a) Construct a frequency distribution for these data, using a class interval of 10 seconds.
(b) Draw a histogram to represent the frequency distribution.
Is it correct to say that in a histogram, the area of each rectangle is proportional to the class size of the corresponding class interval? If not, correct the statement.
Expenditure on Education of a country during a five year period (2002-2006), in crores of rupees, is given below:
| Elementary education | 240 |
| Secondary Education | 120 |
| University Education | 190 |
| Teacher’s Training | 20 |
| Social Education | 10 |
| Other Educational Programmes | 115 |
| Cultural programmes | 25 |
| Technical Education | 125 |
Represent the information above by a bar graph.
The marks obtained (out of 100) by a class of 80 students are given below:
| Marks | Number of students |
| 10 – 20 | 6 |
| 20 – 30 | 17 |
| 30 – 50 | 15 |
| 50 – 70 | 16 |
| 70 – 100 | 26 |
Construct a histogram to represent the data above.
