Advertisements
Advertisements
Question
Describe the qualitative aspects of population.
Solution
- Population: Tamil Nadu stands sixth in population with 7.21 crore.
- Density: Tamil Nadu ranks 12th in density with 555 people per sq. km.
- Urban population: Tamil Nadu is one of the most urbanized states with 48.4% of the urban population.
- Sex ratio: Balanced sex ratio implies improvement in the quality of life of the female population. The sex ratio of Tamil Nadu is nearing balance with 995 which stands third next to Kerala and Puducherry.
- Infant mortality rate: According to NITI AAYOG, the IMR is 17 for Tamil Nadu which is just half of the national average of 34 as of 2016.
- Maternal mortality rate: Tamil Nadu has a good record of controlling MMR, ranking third with 79 against the national average of 159.
- Literacy:
- The literacy rate of Tamil Nadu is higher than in many states.
- Tamil Nadu has the highest Gross Enrollment Ratio in higher education.
APPEARS IN
RELATED QUESTIONS
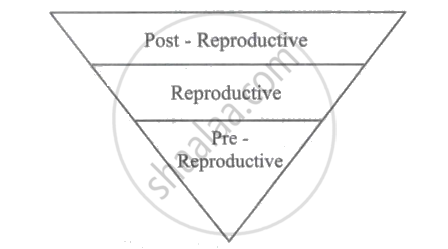
Describe diagrammatic representation of age structure showing declining population.
In literacy rate, TN ranks
State any two districts with favourable sex ratio. Indicate the ratios.
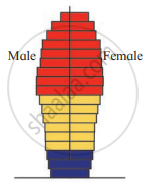
Identify the type of growth in the given figure of age pyramid.

Age pyramid
Which of the following is INCORRECT?
A biologist studied the population of rats in a barn. He found that the average natality was 300, average mortality 250, immigration 50 and emigration 100. The net increase in population is ____________.
Population density at time 't+ l' can be correctly represented as ______.
The number of individuals present per unit space in a given time is known as ______.
What can you interpret from an age pyramid with a broad base?
What will be the birth rate per individual per hour of a population of 50 Paramoecium present in a pool. The population of Paramoecium increases to 150 within an hour.
Identify the type of population depicted in the given pyramid.

Logistic growth curve has many phases which are respectively:
Mortality of a region is assessed by ____________ of individuals per unit area per unit time.
Which of the following conditions represents zero population growth?
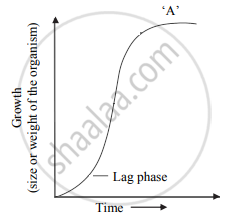
Identify ‘A’ in the given graph of population growth:

The aggregate of processes that determine the size and composition of any population is called ______.
Match the following:
| Column A | Column B | ||
| (i) | Organism | (a) | Large unit with specific climatic zone |
| (ii) | Population | (b) | Different species in particular area |
| (iii) | Community | (c) | Same species in a geographical area |
| (iv) | Biome | (d) | Basic unit of ecological hierarchy |
Identify the appropriate term for the number of births under ideal conditions:
Explain the term Emigration.
