Advertisements
Advertisements
Question
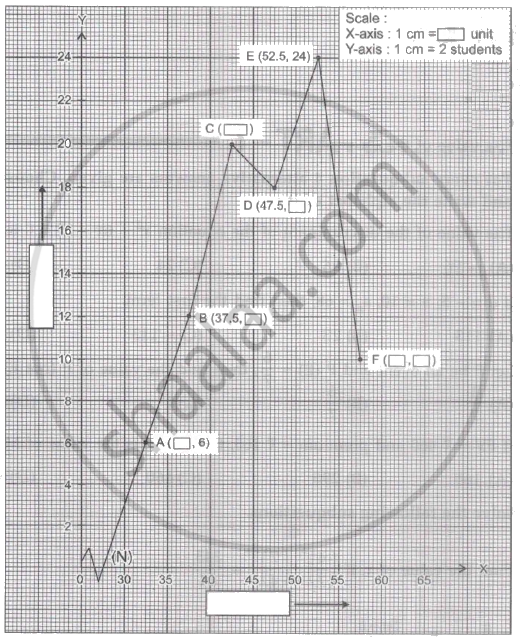
Draw a frequency polygon for the following grouped frequency distribution table.
|
Age of the donor
(Yrs.) |
20 - 24 | 25 - 29 | 30 - 34 | 35 - 39 | 40 - 44 | 45 - 49 |
| No. of blood doners | 38 | 46 | 35 | 24 | 15 | 12 |
Solution
Consider the following table
| Class (Age of doctors in years) |
Continuous Class | Class Mark | Frequency (Number of students) |
| 20 - 24 | 19.5 - 24.5 | 22 | 38 |
| 25 - 29 | 24.5 - 29.5 | 27 | 46 |
| 30 - 34 | 29.5 - 34.5 | 32 | 35 |
| 35 - 39 | 34.5 - 39.5 | 37 | 24 |
| 40 - 44 | 39.5 - 44.5 | 42 | 15 |
| 45 - 49 | 44.5 - 49.5 | 47 | 12 |
The frequency polygon using the class mark and frequancy given in the above table as

APPEARS IN
RELATED QUESTIONS
Draw a frequency polygon from the information given in the following table.
| Age of blood donar (Years) | No. of blood donars |
| Less than 20 | 0 |
| Less than 25 | 30 |
| 75Less than 30 | 75 |
| 165Less than 35 | 127 |
| Less than 40 | 165 |
| Less than 45 | 185 |
| Less than 50 | 197 |
In a handloom factory different workers take different periods of time to weave a saree. The number of workers and their required periods are given below. Present the information by a frequency polygon.
|
No. of days
|
8 - 10 | 10 - 12 | 12 - 14 | 14 - 16 | 16 - 18 | 18 - 20 |
| No. of workers | 5 | 16 | 30 | 40 | 35 | 14 |
The time required for students to do a science experiment and the number of students is shown in the following grouped frequency distribution table. Show the information by a histogram and also by a frequency polygon.
|
Time required for
experiment (minutes) |
20 - 22 | 22 - 24 | 24 - 26 | 26 - 28 | 28 - 30 | 30 - 32 |
| No. of students | 8 | 16 | 22 | 18 | 14 | 12 |
The following table shows the average rainfall in 150 towns. Show the information by a frequency polygon.
|
Average rainfall (cm)
|
0 - 20 | 20 - 40 | 40 - 60 | 60 - 80 | 80 - 100 |
| No. of towns | 14 | 12 | 36 | 48 | 40 |
The maximum bowing speed (km/hour) or 33 players at a cricket coaching centre is given below:
| Bowling Speed(km/hour) | 85-100 | 100-115 | 115-130 | 130-145 |
| Numbers of players | 9 | 11 | 8 | 5 |
find the modal bowling speed of players.
The time required for some students to complete a science experiment and the number of students is shown in the following grouped frequency distribution table. Draw the frequency polygon with the help of histogram using given information:
| Time required for experiment (minutes) | Number of Students |
| 20 - 22 | 6 |
| 22 - 24 | 14 |
| 24 - 26 | 20 |
| 26 - 28 | 16 |
| 28 - 30 | 12 |
| 30 - 32 | 10 |
The distribution of heights (in cm) of 100 people is given below. Construct a histogram and the frequency polygon imposed on it.
| Height (in cm) |
125 − 135 | 136 − 146 | 147 − 157 | 158 − 168 | 169 − 179 | 180 − 190 | 191 − 201 |
| Frequency | 12 | 22 | 18 | 24 | 15 | 7 | 2 |
In a study of dental problem, the following data were obtained.
| Ages | 0 − 10 | 10 − 20 | 20 − 30 | 30 − 40 | 40 − 50 | 50 − 60 | 60 − 70 | 70 − 80 |
| No. of patients | 5 | 13 | 25 | 14 | 30 | 35 | 43 | 50 |
Represent the above data by a frequency polygon.
A _________ is a line graph for the graphical representation of the continuous frequency distribution
In the following frequency distribution, the heights of 90 students are recorded and the frequency polygon is drawn.
| Heights | 30 – 35 | 35 – 40 | 40 – 45 | 45 – 50 | 50 – 55 | 55 – 60 |
| No. of Students | 6 | 12 | 20 | 18 | 24 | 10 |