Advertisements
Advertisements
Question
Draw a graph of each of the following equations: 2x = 7
Solution
2x = 7
⇒ x = `(7)/(2)`
The graph of 2x = 7 is a straight line which is parallel to the y-axis at a distance of `(7)/(2)` units from it.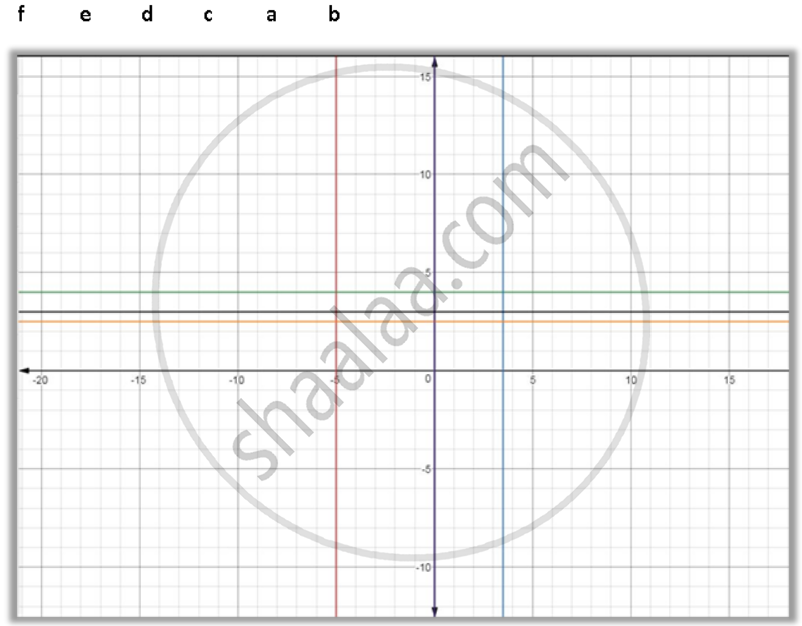
APPEARS IN
RELATED QUESTIONS
Use the graph given alongside, to find the coordinates of the point (s) satisfying the given condition:
(i) The abscissa is 2.
(ii)The ordinate is 0.
(iii) The ordinate is 3.
(iv) The ordinate is -4.
(v) The abscissa is 5.
(vi) The abscissa is equal to the ordinate.
(vii) The ordinate is half of the abscissa.

In the following, the coordinates of the three vertices of a rectangle ABCD are given. By plotting the given points; find, in case, the coordinates of the fourth vertex:
A(2, 0), B(8, 0) and C(8, 4).
A (- 2, 2), B(8, 2) and C(4, - 4) are the vertices of a parallelogram ABCD. By plotting the given points on a graph paper; find the co-ordinates of the fourth vertex D.
Also, form the same graph, state the co-ordinates of the mid-points of the sides AB and CD.
A (-2, 4), C(4, 10) and D(-2, 10) are the vertices of a square ABCD. Use the graphical method to find the co-ordinates of the fourth vertex B. Also, find:
(i) The co-ordinates of the mid-point of BC;
(ii) The co-ordinates of the mid-point of CD and
(iii) The co-ordinates of the point of intersection of the diagonals of the square ABCD.
Plot the following points on the graph paper: P(2, 5), Q(4, 0), R(0, 7), S(-3, 5), T(4, -4), U(0, -2) and V(-1, -4)
Draw a graph of each of the following equations: y - 4 = 0
Draw a graph of each of the following equations: x = 0
Draw a graph of each of the following equations: y = 3
Draw a graph for the following data:
| Side of a square (cm) | 2 | 3 | 4 | 5 | 6 |
| Area (cm2) | 4 | 9 | 16 | 25 | 36 |
Does the graph represent a linear relation?
Consider the number of angles of a convex polygon and the number of sides of that polygon. Tabulate as follows:
| Name of Polygon | No. of angles | No. of sides |
Use this to draw a graph illustrating the relationship between the number of angles and the number of sides of a polygon
