Advertisements
Advertisements
Question
Draw a graph of each of the following equations: y - 4 = 0
Solution
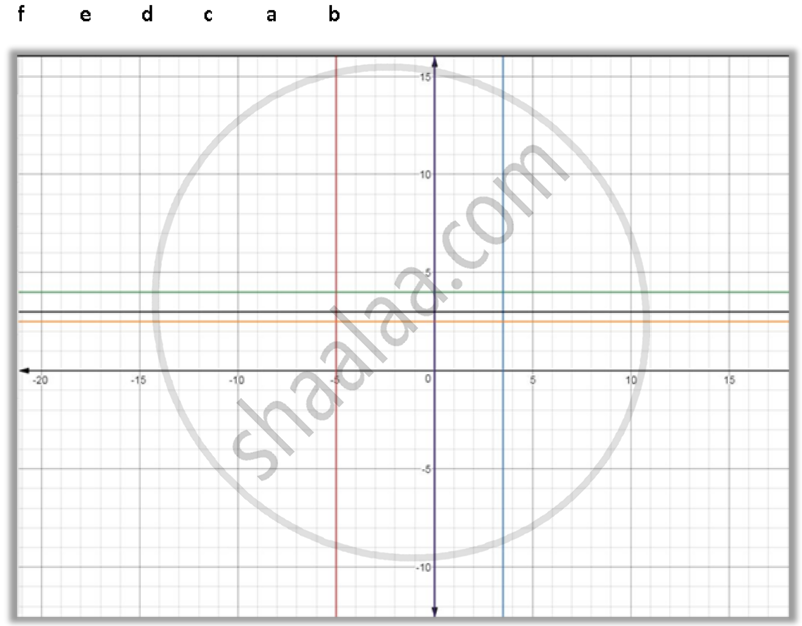
y - 4 = 0
⇒ y = 4
The graph of y - 4 = 0 is a straight line which is parallel to the x-axis at a distance of 4units from it.
APPEARS IN
RELATED QUESTIONS
In the following, the coordinates of the three vertices of a rectangle ABCD are given. By plotting the given points; find, in case, the coordinates of the fourth vertex:
A(2, 0), B(8, 0) and C(8, 4).
In the following, the coordinates of the three vertices of a rectangle ABCD are given. By plotting the given points; find, in case, the coordinates of the fourth vertex:
A (- 4, - 6), C(6, 0) and D(- 4, 0).
A (- 2, 2), B(8, 2) and C(4, - 4) are the vertices of a parallelogram ABCD. By plotting the given points on a graph paper; find the co-ordinates of the fourth vertex D.
Also, form the same graph, state the co-ordinates of the mid-points of the sides AB and CD.
A (-2, 4), C(4, 10) and D(-2, 10) are the vertices of a square ABCD. Use the graphical method to find the co-ordinates of the fourth vertex B. Also, find:
(i) The co-ordinates of the mid-point of BC;
(ii) The co-ordinates of the mid-point of CD and
(iii) The co-ordinates of the point of intersection of the diagonals of the square ABCD.
Draw a graph of each of the following equations: x + 5 = 0
Draw a graph of each of the following equations: 2y - 5 = 0
Draw a graph of each of the following equations: x = 0
Draw a graph of each of the following equations: y = 3
Draw a graph for the following data:
| Side of a square (cm) | 2 | 3 | 4 | 5 | 6 |
| Area (cm2) | 4 | 9 | 16 | 25 | 36 |
Does the graph represent a linear relation?
Draw the graph of the lines y = x, y = 2x, y = 3x and y = 5x on the same graph sheet. Is there anything special that you find in these graphs?
