Advertisements
Advertisements
Question
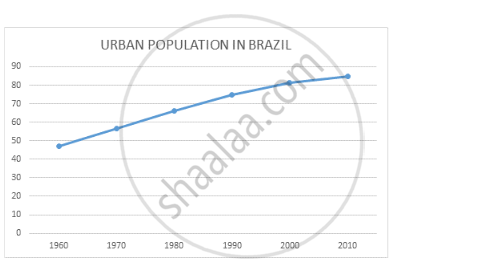
Draw a line graph from this table. Examine the graph carefully and answer the following questions.
Brazil percentage of urban population (1960 - 2010)
| 1960 | 1970 | 1980 | 1990 | 2000 | 2010 |
| 47.1 | 56.8 | 66 | 74.6 | 81.5 | 84.6 |
- What is the interval of the data?
- In which period did urbanisation occur rapidly?
- Write five sentences analysing the graph.
Solution
- The data depicts the urban population of Brazil between 1960 and 2010. The interval represents the time span between the data is collected. Thus the interval of data is 10 years.
- Urbanisation refers to the movement of people and human settlements from the rural areas to the urban areas. Employment opportunities, higher standard of living, better facilities and infrastructure force people to migrate from rural areas to urban areas. Rapid urbanisation occurred between 1960 and 1970. It was around 9.7% increase.
- Urbanisation refers to the movement of people and human settlements from the rural areas to the urban areas. Rapid urbanisation is taking place in India because of the rapid increase in its population. Because of the increase in its population, people require more land and other resources. Thus villages have given way to the formation of cities and have contributed to the migration of people from rural res to urban areas. Other factors like employment opportunities, a higher standard of living, better facilities and infrastructure also force people to migrate from rural areas to urban areas. Between these years, Brazil is experiencing increasing urbanisation. In 2010, Brazil had 84.6% of people living in urban areas.
RELATED QUESTIONS
The rate of urbanization in Brazil has reduced after the ---------------- decade
Which State has the least urbanization in Brazil?
Distinguish between
Urbanisation in India and Brazil
Which is the most urbanised state in Brazil?
Prepare a simple bar graph with the help of given statistical information and answer the questions given below-
Brazil-% of urban population
| Year | % of urban population |
| 1960 | 47.1 |
| 1970 | 56.8 |
| 1980 | 66.0 |
| 1990 | 74.6 |
| 2000 | 81.5 |
| 2010 | 84.6 |
Questions-
- What is the interval of years in the data?
- During which year did rapid urbanization start?
- Write five sentences about the analysis of graph.
With the help of given statistical data Prepare a simple bar graph and answer the following questions :
Percentage of Urban Population-Brazil
(1960 to 2010)
| Years | % of urban population |
| 1960 | 47.1 |
| 1970 | 56.8 |
| 1980 | 66.0 |
| 1990 | 74.6 |
| 2000 | 81.5 |
| 2010 | 84.6 |
Questions-
- What does the above line graph show?
- In which decade urbanisation occurred slowly ?
- What was the percentage of increase in urbanisation during the period from 1980 to 1990 ?
State whether the sentence is right or wrong. Correct the wrong ones and rewrite the sentence.
Urbanisation has occurred more in the coastal states than the states in the interior of Brazil.
______ port is located on the confluence of the Negro and the Amazon.
What is the state of urbanisation in Brazil and why is it concentrated near coastal areas?
Which factors have affected urbanisation in Brazil?
