Advertisements
Advertisements
Question
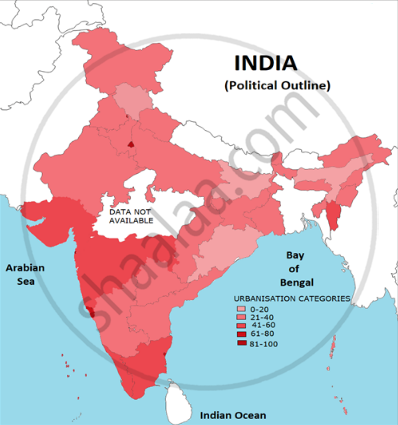
Prepare a choropleth map showing the urban population using the data given in the table below.
| S.NO | Urban population percentage category | States /UTs falling in the category |
| 1. | 0-20 | Himachal Pradesh, Bihar, Assam, Odisha |
| 2. | 21-40 | Meghalaya, Uttar Pradesh, Arunachal Pradesh, Chhattisgarh, Jharkhand, Rajasthan, Sikkim, Tripura, Jammu & Kashmir, Nagaland, Manipur, Uttarakhand, West Bengal, Andhra Pradesh, Haryana, A & N Islands, Punjab, Karnataka |
| 3. | 41-60 | Gujarat, Maharashtra, Dadra & Nagar Haveli, Kerala, Tamil Nadu, Mizoram |
| 4. | 61-80 | Goa, Puducherry, Daman & Diu, Lakshadweep |
| 5. | 81-100 | Chandigarh, NCT of Delhi |
Solution
RELATED QUESTIONS
Answer in detail:
Explain in detail about urbanization in India .
Concentrated settlements are found in Narmada Valley because of ______
Give a geographical reason.
Urbanization is increasing rapidly in India.
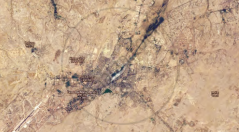
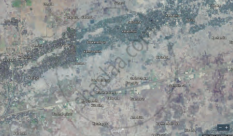
Tell whether settlements shown in images (a) and (b) are urban or rural.
|
(a) |
(b) |
Read the graph in Fig. below and answer the following questions:
- What was the percentage of urbanisation in 1961?
- In which decade was urbanisation the highest?
- In which decade was the growth of urbanisation lowest?
- What inference can you draw regarding India’s urbanisation after reading the graph?
- In which decade is the percentage of urbanization 27.8?
- What is the difference between the percentage of urbanisation from 1971 and 1981?

State whether right or wrong.
Development of roads is one of the development index of a country.
Write a short note.
Comparison of urbanisation in Brazil and India
Find the correct pair.
Indian states with less than 20% urbanisation.
Read the graph given below and answer the following questions:
|
India-trend of urbanisation (1961-2011) |
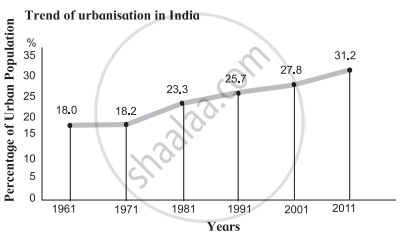
- What was the percentage of urbanisation in 1961?
- In which decade was urbanisation the highest?
- In which decade was the growth of urbanisation lowest?
- What inference can you draw regarding India’s urbanisation after reading the graph?
With the help of given statistical data, prepare a simple bar graph and answer the following questions:
Trend of Urbanisation in India (1961 to 2011)
| Year | Percentage % of Urban Population in India |
| 1961 | 18.0 |
| 1971 | 18.2 |
| 1981 | 23.3 |
| 1991 | 25.7 |
| 2001 | 27.8 |
| 2011 | 31.2 |
- What was the percentage of urbanisation in the year 1961?
- In which decade was the growth of urbanisation lowest?
- What was the percentage of urbanisation in the year 1991?
