Advertisements
Advertisements
Question
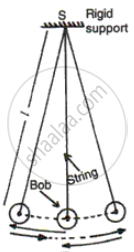
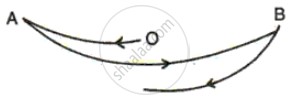
Draw a neat diagram of a simple pendulum. Show on it the effective length of the pendulum and its one oscillation .
Solution 1
Simple Pendulum :

Solution 2
Diagram of a simple pendulum


The figure below shows one oscillation of a simple pendulum

O → A, A → B, B → 0 is one oscillation.
RELATED QUESTIONS
Compare the time periods of the two pendulums of lengths 1 m and 9 m.
A student calculates experimentally the value of density of iron as 7.4 gcm−3. If the actual density of iron is 7.6 gcm−3, calculate the percentage error in the experiment.
The length of the two pendulum are 110 cm and 27.5 cm. Calculate the ratio of their time periods.
Define simple pendulum.
A second’s pendulum is taken on the surface of the moon where the acceleration due to gravity is l/6th of that of earth. Will the time period of pendulum remain the same or increase or decrease? Give a reason.
Amongst the independent variable and dependent variable, which is plotted on X-axis?
State two important precautions for drawing a graph line.
What is a best fit line for a graph?
Name the factors on which the time period of a simple pendulum depends. Write the relation for the time period in terms of the above named factors.
