Advertisements
Advertisements
Question
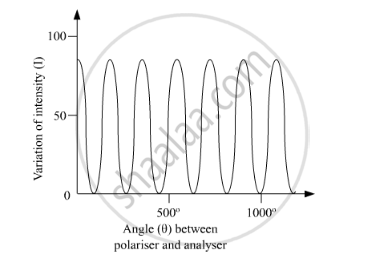
Draw a graph showing the variation of intensity (I) of polarised light transmitted by an analyzer with the angle (θ) between polariser and analyzer.
Solution

APPEARS IN
RELATED QUESTIONS
How is linearly polarised light obtained by the process of scattering of light. Find the Brewster angle for air – glass interface, when the refractive index of glass = 1.5.
Distinguish between unpolarized light and linearly polarized light
Distinguish between polarized and unpolarized light. Does the intensity of polarized light emitted by a polaroid depend on its orientation? Explain briefly.
The vibration in a beam of polarized light make an angle of 60° with the axis of the polaroid sheet. What percentage of light is transmitted through the sheet?
Distinguish between unpolarised and linearly polarised light.
Explain with the help of a diagram how sunlight is polarised by scattering through atmospheric particles ?
Explain briefly how sunlight is polarised by scattering through atmospheric particles.
What is an unpolarized light? Explain with the help of suitable ray diagram how an unpolarized light can be polarized by reflection from a transparent medium. Write the expression for Brewster angle in terms of the refractive index of denser medium.
If the angle between the pass axis of polarizer and the analyser is 45º, write the ratio of the intensities of original light and the transmitted light after passing through the analyser.
How will you identify with the help of an experiment whether a given beam of light is of polarized light or of unpolarized light?
Distinguish between unpolarized and linearly polarized light.
