Advertisements
Advertisements
Question
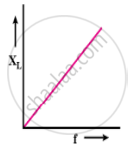
Draw graphs showing the variations of inductive reactance and capacitive reactance with the frequency of the applied ac source.
Solution
 |
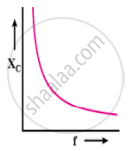 |
| (a) | (b) |
APPEARS IN
RELATED QUESTIONS
Why is choke coil needed in the use of fluorescent tubes with ac mains?
Define inductive reactance and give its units.
Calculate the instantaneous value at 60°, average value and RMS value of an alternating current whose peak value is 20 A.
A choke coil in series with a lamp is connected to a dc line. The lamp is seen to shine brightly. Insertion of an iron core in the choke causes no change in the lamp’s brightness. Predict the corresponding observations if the connection is to an ac line.
The capacitive reactance in an A.C. circuit is ______.
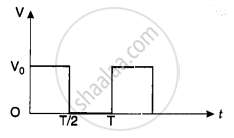
The rms value of potential difference V shown in the figure is ______.
In an a.c circuit, peak value of voltage is 423 volts, its effective voltage is ______.
In young's double slit experiment `"d"/"D"`= 10-4 D (d = distance between slits, D = distance of screen from the slits). At a point P on the screen resulting intensity is equal to the intensity due to individual slit l0. Then the distance of point P from the central maximum is (λ = 6000 `"A"^°`)
The r.m.s. value of alternating current is 10 A, having frequency of 50 Hz. The time taken by the current to increase from zero to maximum and the maximum value of current will be ______.
State any one difference between a direct current (dc) and an alternating current (ac).
