Advertisements
Advertisements
प्रश्न
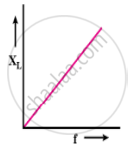
Draw graphs showing the variations of inductive reactance and capacitive reactance with the frequency of the applied ac source.
उत्तर
 |
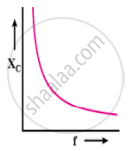 |
| (a) | (b) |
APPEARS IN
संबंधित प्रश्न
Derive the relationship between the peak and the rms value of current in an a.c. circuit.
How will you define RMS value of an alternating current?
What are phasors?
What do you mean by resonant frequency?
Obtain an expression for average power of AC over a cycle. Discuss its special cases.
When does power factor of a series RLC circuit become maximum?
In an alternating current circuit consisting of elements in series, the current increases on increasing the frequency of supply. Which of the following elements are likely to constitute the circuit?
- Only resistor.
- Resistor and an inductor.
- Resistor and a capacitor.
- Only a capacitor.
An inductor of 0.5 mH, a capacitor of 200 µF, and a resistor of 2Ω are connected in series with a 220V ac source. If the current is in phase with the emf, the frequency of ac source will be ______ × 102 Hz.
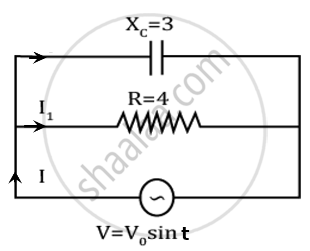
A capacitor and resistor are connected with an AC source as shown in figure. Reactance of capacitor is XC = 3 Ω and resistance of resistor is 4 Ω. Phase difference between current I and I1 is approx ______.
A series CR circuit with R = 200 Ω and C = (50/π) µF is connected across an ac source of peak voltage ε0 = 100 V and frequency v = 50 Hz. Calculate (a) impedance of the circuit (Z), (b) phase angle (Φ), and (c) voltage across the resistor.
