Advertisements
Advertisements
Question
Draw the following graph:
Speed versus time for a stepped motion
Solution
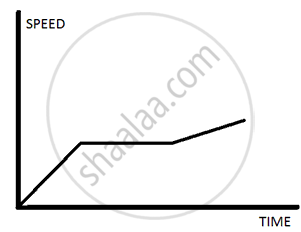
Speed time graph for a stepped motion
APPEARS IN
RELATED QUESTIONS
The velocity-time graph for part of a train journey is a horizontal straight line. What does this tell you about its acceleration ?
A car of mass 1000 kg is moving with a velocity of 10 m s−1. If the velocity-time graph for this car is a horizontal line parallel to the time axis, then the velocity of car at the end of 25 s will be :
What does the slope of velocity-time graph represent?
From the velocity – time graph given below, calculate acceleration in the region AB.

From the velocity – time graph given below, calculate Average velocity in region CED.
Represent the position of a body described as at 15 m, 30o north of west, on a graph paper.
Given on th e side are a few speed - time graphs for various objects moving along a stra ight line. Refer below figure. (a), (b), (c) and (d).
Which of these graphs represent
(a) Uni form motion
(b) Motion with speed increasing
(c) Motion with speed decreasing and
(d) Motion with speed oscillating.?
Draw the speed-time graph of a body when its initial speed is not zero and the speed increases uniformly with time.
Figure shows the distance-time graph of three students A, B and C. On the basis of the graph, answer the following :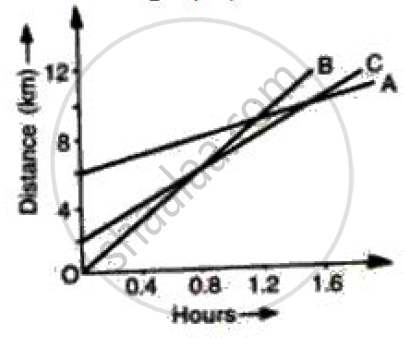
Will the three ever meet at any point on the road?
From the v-t graph, ______ can be calculated.
