Advertisements
Advertisements
Question
From the velocity – time graph given below, calculate Average velocity in region CED.

Solution
Displacement covered in region ΔCDE = area of ΔCDE
= `1/2xx"ED"xx"CE"`
= `1/2xx(28-16)xx6`
= `1/2xx12xx6`
= 36 m
Average velocity in region CED = `"Total displacement"/"Time"`
= `36/12`
= 3 ms−1
APPEARS IN
RELATED QUESTIONS
The velocity-time graph for part of a train journey is a horizontal straight line. What does this tell you about its acceleration ?
A car of mass 1000 kg is moving with a velocity of 10 m s−1. If the velocity-time graph for this car is a horizontal line parallel to the time axis, then the velocity of car at the end of 25 s will be :
From the displacement-time graph of a cyclist given below in the Figure, find The time after which he reaches the starting point .

Multiple choice Question. Select the correct option.
What does the area of an acceleration – time graph represent?
Diagram shows a velocity – time graph for a car starting from rest. The graph has three sections AB, BC and CD.

From a study of this graph, state how the distance travelled in any section is determined.
Diagram is given below shows velocity – time graph of car P and Q, starting from the same place and in the same direction. Calculate which car is ahead after 10 s and by how much?

Name the physical quantity which is equal to the area under speed-time graph.
Draw the following graph:
Speed versus time for a stepped motion
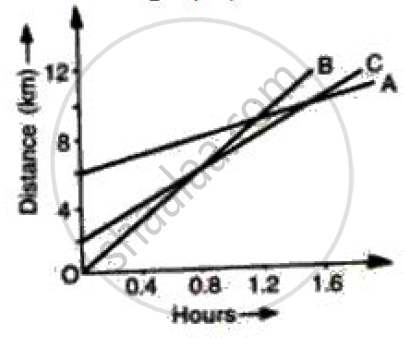
Figure shows the distance-time graph of three students A, B and C. On the basis of the graph, answer the following :
Which of the three is traveling the fastest?
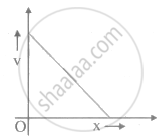
The given graph shows the variation of velocity (v) with position (x) for a particle moving along a straight line

Which of the following graph shows the variation of acceleration (a) with position (x)?
