Advertisements
Advertisements
Question
Diagram is given below shows velocity – time graph of car P and Q, starting from the same place and in the same direction. Calculate which car is ahead after 10 s and by how much?

Solution

Distance covered by car P = area of ΔOAB
= `1/2xx"OB"xx"AB"`
= `1/2xx10xx35`
= 175 m
Distance covered by car Q = area of ΔCDE + area of rectangle DFBE
= `1/2xx"CE"xx"DE"+"EB"xx"BF"`
= `1/2xx(5-2)xx25+(10-5)xx25`
= `75/2+125`
= 37.5 + 125
= 162.5 m
So, car P is a head of car Q by (175 − 162.5) m
i.e. by 12.5 m
APPEARS IN
RELATED QUESTIONS
Draw a velocity-time graph to show the following motion :
A car accelerates uniformly from rest for 5 s ; then it travels at a steady’ velocity for 5 s.
Show by means of graphical method that: v = u + at, where the symbols have their usual meanings.
Show by using the graphical method that: `s=ut+1/2at^2` where the symbols have their usual meanings.
Draw velocity – time graph for the following situation:
When a body is moving with variable velocity, but uniform acceleration.
A train starting from rest picks up a speed of 20 ms−1 in 200 s. It continues to move at the same rate for the next 500 s and is then brought to rest in another 100 s.
- Plot a speed-time graph.
- From graph calculate
(a) uniform rate of acceleration
(b) uniform rate of retardation
(c) total distance covered before stopping
(d) average speed.
From the velocity – time graph given below, calculate Distance covered in the region ABCE.

Figure shows displacement- time graph of two objects A and B moving in a stra ight line. Which object is moving fa ster?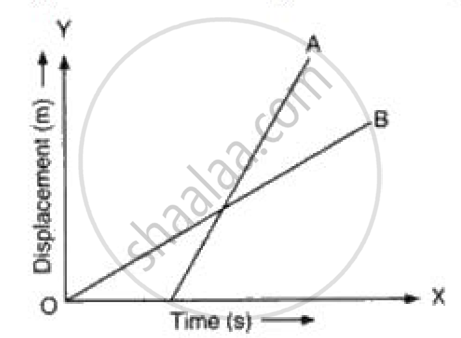
Sketch the shape of the velocity-time graph for a body moving with:
Uniformly velocity
Figure shows the distance-time graph of three students A, B and C. On the basis of the graph, answer the following :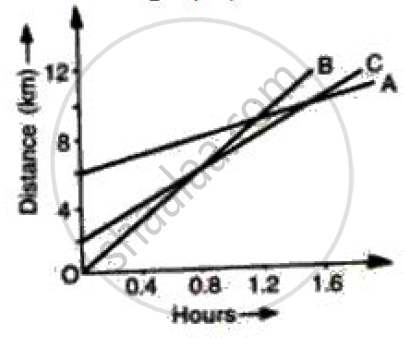
How far did B travel between the time he passed C and A?
The given graph shows the variation of velocity (v) with position (x) for a particle moving along a straight line
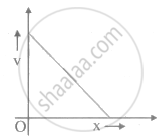
Which of the following graph shows the variation of acceleration (a) with position (x)?
