Advertisements
Advertisements
Question
Figure shows the distance-time graph of three students A, B and C. On the basis of the graph, answer the following :
How far did B travel between the time he passed C and A?
Solution
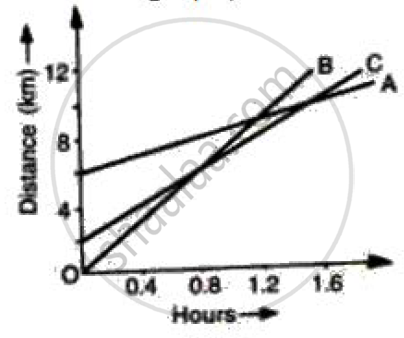
8 travel 4 km between the time he passed C and A.
APPEARS IN
RELATED QUESTIONS
What is the quantity which is measured by the area occupied below the velocity-time graph?
Show by means of graphical method that: v = u + at, where the symbols have their usual meanings.
Given alongside is the velocity-time graph for a moving body :
Find :
(i) Velocity of the body at point C.
(ii) Acceleration acting on the body between A and B.
(iii) Acceleration acting on the body between B and C.

The speed-time graph of an ascending passenger lift is given alongside. What is the acceleration of the lift:
(1) during the first two seconds ?
(2) between second and tenth second ?
(3) during the last two seconds ?
Draw a velocity-time graph for the free fall of a body under gravity starting from rest. Take g = 10m s-2
Multiple choice Question. Select the correct option.
In the velocity-time graph, the acceleration is
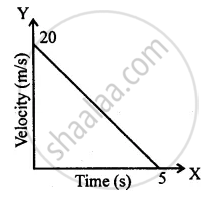
Diagram shows a velocity – time graph for a car starting from rest. The graph has three sections AB, BC, and CD.

In which section, car has a zero acceleration?
A train starting from rest picks up a speed of 20 ms−1 in 200 s. It continues to move at the same rate for the next 500 s and is then brought to rest in another 100 s.
- Plot a speed-time graph.
- From graph calculate
(a) uniform rate of acceleration
(b) uniform rate of retardation
(c) total distance covered before stopping
(d) average speed.
The area under velocity – time graph represents the ______
The given graph shows the variation of velocity (v) with position (x) for a particle moving along a straight line
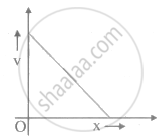
Which of the following graph shows the variation of acceleration (a) with position (x)?
