Advertisements
Advertisements
Question
The speed-time graph of an ascending passenger lift is given alongside. What is the acceleration of the lift:
(1) during the first two seconds ?
(2) between second and tenth second ?
(3) during the last two seconds ?
Solution
(i) We have to find the acceleration from the given graph.
Acceleration = slope of line AB
= `((4.6-0))/((2-0)) "m/s"^2`
= 2.3 `"m/s"^2`
(ii) Between second and tenth second, it represents uniform speed, so, acceleration acting on the lift is zero.
(iii) During the last two seconds, it represents retardation of the lift, so its acceleration is (–2.3 m/s2).
APPEARS IN
RELATED QUESTIONS
What is the quantity which is measured by the area occupied below the velocity-time graph?
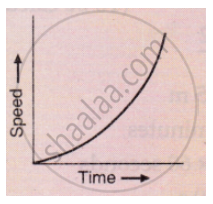
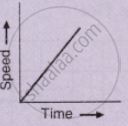
What conclusion can you draw about the acceleration of a body from the speed-time graph shown below .
Name the two quantities, the slope of whose graph give acceleration.
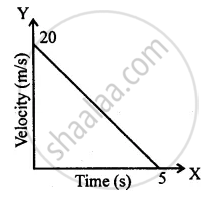
Given alongside is the velocity-time graph for a moving body :
Find :
(i) Velocity of the body at point C.
(ii) Acceleration acting on the body between A and B.
(iii) Acceleration acting on the body between B and C.

What type of motion is represented by the following graph ?
For uniform motion _________
Multiple choice Question. Select the correct option.
In the velocity-time graph, the acceleration is
A train starting from rest picks up a speed of 20 ms−1 in 200 s. It continues to move at the same rate for the next 500 s and is then brought to rest in another 100 s.
- Plot a speed-time graph.
- From graph calculate
(a) uniform rate of acceleration
(b) uniform rate of retardation
(c) total distance covered before stopping
(d) average speed.
Diagram is given below shows velocity – time graph of car P and Q, starting from the same place and in the same direction. Calculate which car is ahead after 10 s and by how much?

Draw velocity-time graph to show:
Deceleration
Write a sentence to explain the shape of graph.
