Advertisements
Advertisements
Question
Name the two quantities, the slope of whose graph give acceleration.
Solution
The slope of the graph of velocity v/s time gives acceleration.
APPEARS IN
RELATED QUESTIONS
Fill in the following blank with suitable word :
In a speed-time graph, the area enclosed by the speed-time curve and the time axis gives the…………….. by the body.
The velocity-time graph for part of a train journey is a horizontal straight line. What does this tell you about the trains velocity.
Given alongside is the velocity-time graph for a moving body :
Find :
(i) Velocity of the body at point C.
(ii) Acceleration acting on the body between A and B.
(iii) Acceleration acting on the body between B and C.

A car of mass 1000 kg is moving with a velocity of 10 m s−1. If the velocity-time graph for this car is a horizontal line parallel to the time axis, then the velocity of car at the end of 25 s will be :
Multiple choice Question. Select the correct option.
A graph is a straight line parallel to the time axis in a distance-time graph. From the graph, it implies:
A train starting from rest picks up a speed of 20 ms−1 in 200 s. It continues to move at the same rate for the next 500 s and is then brought to rest in another 100 s.
- Plot a speed-time graph.
- From graph calculate
(a) uniform rate of acceleration
(b) uniform rate of retardation
(c) total distance covered before stopping
(d) average speed.
Draw the following graph:
Speed versus time for a non-uniform acceleration.
Figure shows displacement- time graph of two objects A and B moving in a stra ight line. Which object is moving fa ster?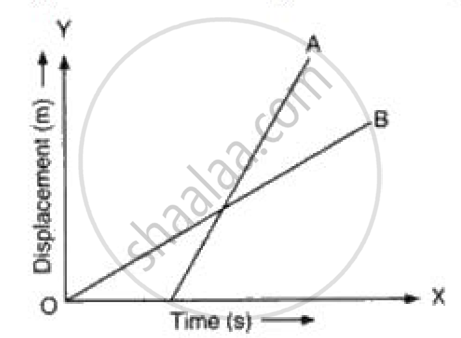
Figure shows the distance-time graph of three students A, B and C. On the basis of the graph, answer the following :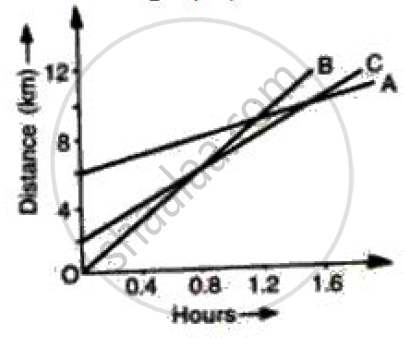
How far did B travel between the time he passed C and A?
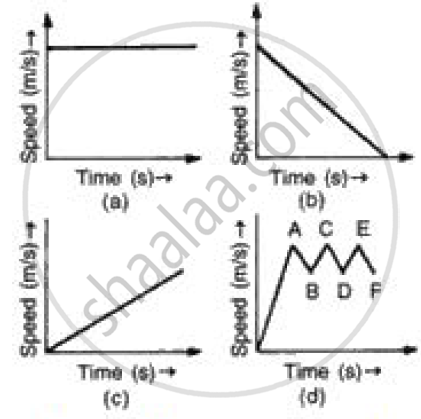
(i) In speed time graph uniform motion is given by a straight line parallel to x axis so figure (a) denotes the uniform motion.
(ii) In speed time graph motion with increasing speed is shown by straight line with positive slope so figure (c) denotes the motion with speed increasing.
(iii) In speed time graph motion with decreasing speed is shown by straight line with negative slope so figure (b) denotes the motion with speed decreasing.
(iv) In speed time graph motion with oscillating speed is shown by zigzag line so figure {d) denotes the motion with speed oscillating.
