Advertisements
Advertisements
Question
Explain aggregate supply with the help of a diagram.
Diagram
Long Answer
Solution
- Aggregate supply function is an increasing function of the level of employment.
- Aggregate supply refers to the value of the total output of goods and services produced in an economy in a year.
- In other words, aggregate supply is equal to the value of national product, i.e., national income.
- Aggregate Supply = C + S + T + Rf = Aggregate income generated in the economy.
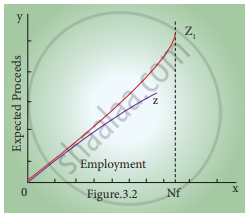
- The following figure shows the shape of the two aggregate supply curves drawn for the assumption of fixed money wages and variable wages.
Aggregate Supply Curve
- Z curve is linear where money wages remain fixed; Z<sub>1</sub> curve is non – linear since the wage rate increases with employment.
- When the full employment level of Nf is reached it is impossible to increase output by employing more men.
- So aggregate supply curve becomes inelastic (Vertical straight line).
- The slope of the aggregate supply curve depends on the relation between employment and productivity.
- Based upon this relation, the aggregate supply curve can be expected to slope upwards.
- In reality, the aggregate supply curve will be like Z1
- Therefore, the aggregate supply depends on the relationship between price and wages.
shaalaa.com
Effective Demand
Is there an error in this question or solution?
APPEARS IN
RELATED QUESTIONS
The main contention of the Classical Economic Theory is______.
Keynes attributes unemployment to______.
The component of aggregate demand is______.
Aggregate supply is equal to______.
What is effective demand?
What are the components of aggregate supply?
What do you mean by aggregate demand?
Mention its components.
Aggregate demand
Narrate the equilibrium between ADF and ASF with a diagram.
