Advertisements
Advertisements
Question
Narrate the equilibrium between ADF and ASF with a diagram.
Diagram
Long Answer
Solution
- Under the Keynes theory of employment, a simple two-sector economy consisting of the household sector and the business sector is taken to understand the equilibrium between ADF and ASF.
- All the decisions concerning consumption expenditure are taken by the individual households, while the business firms take decisions concerning investment.
- It is also assumed that the consumption function is linear and planned investment is autonomous.
- There are two approaches to the determination of the equilibrium level of income in Keynesian theory. These are:
- Aggregate demand – Aggregate supply approach
- Saving – Investment approach –
- In this chapter, out of these two, the aggregate demand and aggregate supply approach is alone explained to understand the determination of equilibrium level of income and employment.
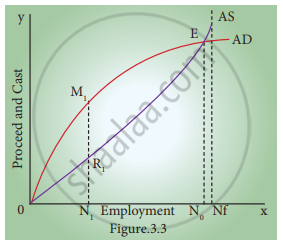
- The concept of effective demand is more clearly shown in the figure.
- In the figure, the aggregate demand and aggregate supply reach equilibrium at point E. The employment level is N0 at that point.
- At ON1 employment, the aggregate supply is N, Rr But they are able to produce M1 N1 The expected level of profit is M1, R1
- To attain this level of profit, entrepreneurs will employ more labourers.
- The tendency to employ more labour will stop once they reach point E.
- At all levels of employment beyond, ON0, the aggregate demand curve is below the aggregate supply curve indicating loss to the producers.
- Hence they will never employ more than ON0 labour.
- Thus effective demand concept becomes a crucial point in determining the equilibrium level of output in the capitalist economy or a free market economy in the Keynesian system.
- It is important to note that the equilibrium level of employment need not be the full employment level (N<sub>1</sub>) from the Figure, it is understood that the difference between N0 – N0 is the level of unemployment.
- Thus the concept of effective demand becomes significant in explaining the under employment equilibrium.
shaalaa.com
Effective Demand
Is there an error in this question or solution?
APPEARS IN
RELATED QUESTIONS
The main contention of the Classical Economic Theory is______.
Keynes attributes unemployment to______.
The component of aggregate demand is______.
Aggregate supply is equal to______.
What is effective demand?
What are the components of aggregate supply?
What do you mean by aggregate demand?
Mention its components.
Aggregate demand
Explain aggregate supply with the help of a diagram.
