Advertisements
Advertisements
Question
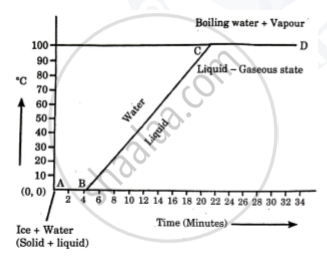
Explain the following temperature Vs. time graph:
Answer in Brief
Solution
At point A, water is in solid state i.e. ice.
Between A to B ice is changing to water without rise in temperature {Melting of ice} so 00C is the melting point. From B to C temperature rises with time as heat is provided to water. At point C to D, water is changing to steam without change in temperature. So it is the boiling point. Hence 1000C is the boiling point of water.
shaalaa.com
Is there an error in this question or solution?
